Math Waveforms 5
Keysight InfiniiVision 3000T X-Series Oscilloscopes User's Guide 121
Math Visualizations
You can apply visualization math functions that give you different ways of viewing
captured data and measurement values.
• “Magnify" on page 121
• “Maximum/Minimum" on page 122
• “Peak-Peak" on page 122
• “Max/Min Hold" on page 122
• “Measurement Trend" on page 122
• “Chart Logic Bus Timing" on page 124
• “Chart Logic Bus State" on page 125
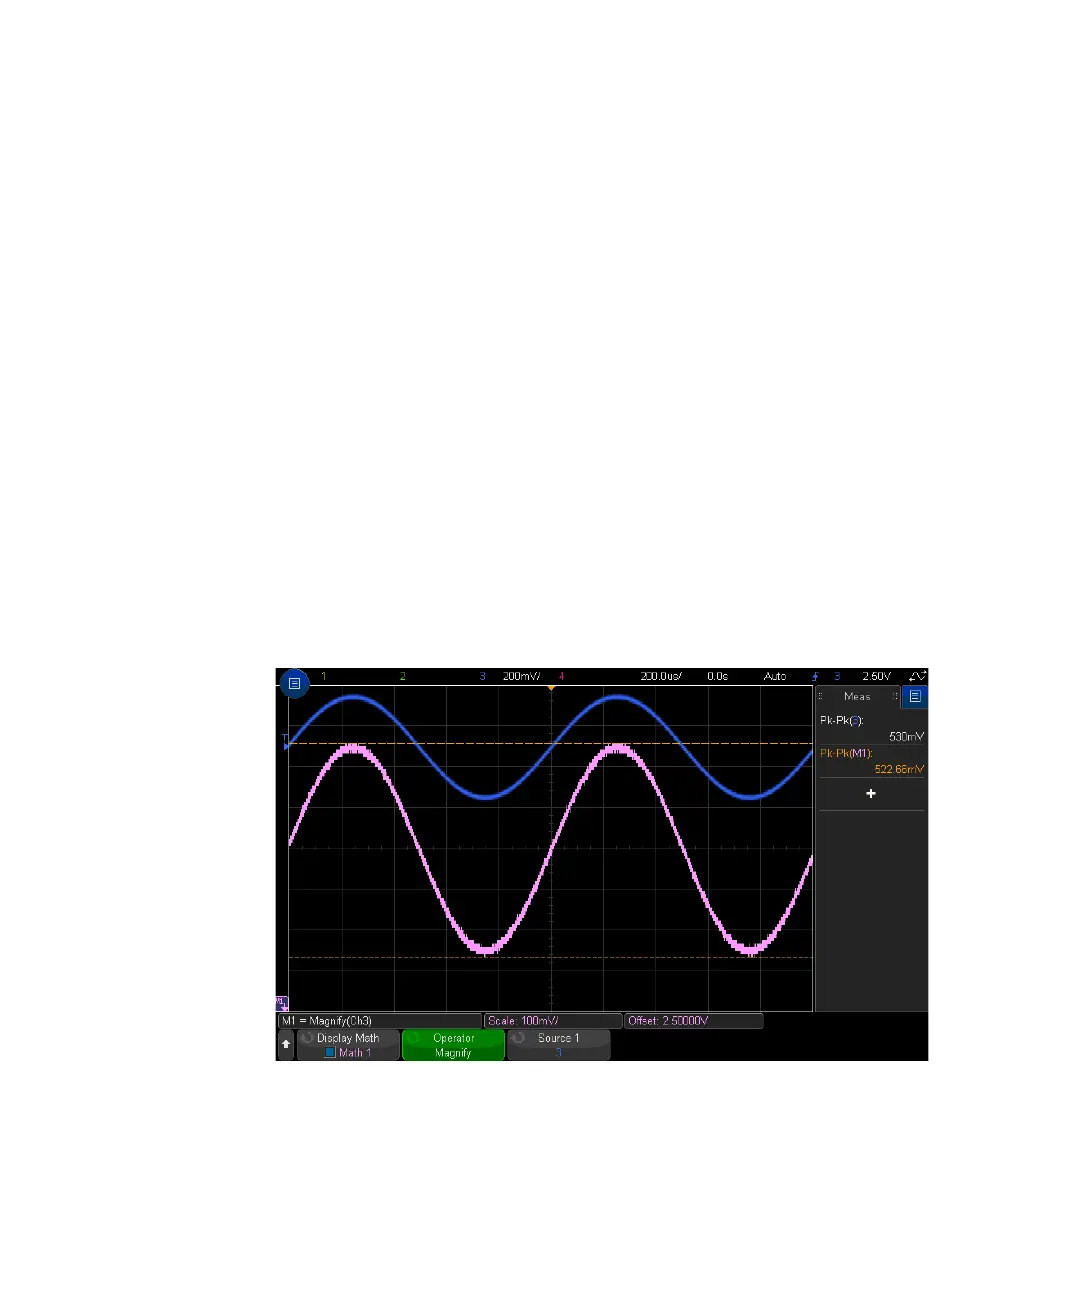
Magnify
The magnify math function lets you display an existing input source at different
vertical settings to provide more vertical detail.
Figure 17 Example of Magnify