258 WM-OM-E Rev I
Example 5
Next, a logarithmic vertical scale, for which the script can be found here. (Most scripts would be far
simpler than this one.)
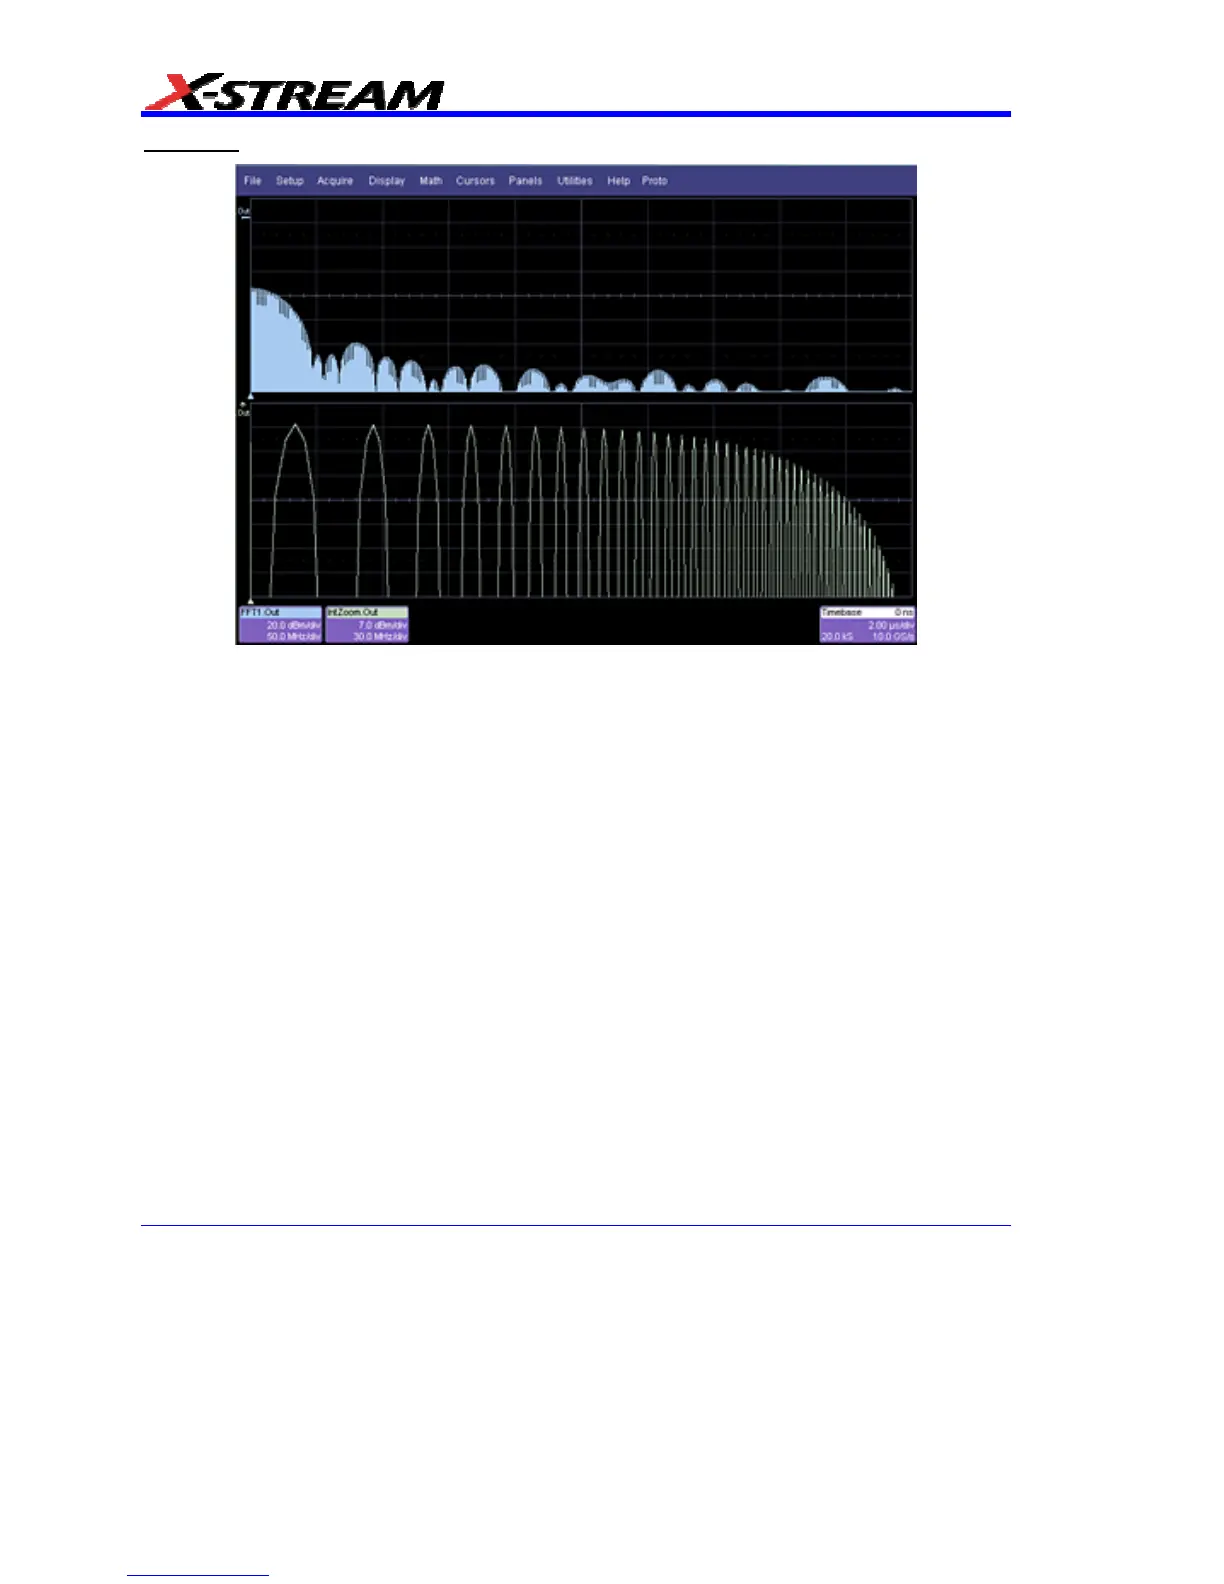
Frequency response curves are frequently drawn on a logarithmic scale. The upper trace is a
frequency spectrum of a square wave after enhanced resolution has been applied. It was created
using instrument functions. The lower trace is the first lobe of the FFT display. But with a logarithmic
frequency scale. Click here for the VBScript.
In addition to VBScripting, MATLAB, Mathcad, or Excel can also be used to generate a result. The
F1 trace (shown below in Example 6) was calculated in MATLAB (F1=WformOut) from C1
(WformIn1) and C2 (WformIn2). The same calculation could also be done in Excel by using a
simple formula in a spreadsheet cell.