Measuring Principles
1016en01 03-11-24 29
To overcome the above mentioned problem, the instrument utilizes a so-called
mathematical differential, where the curves are analyzed within the software and
3 separate curves are built through a curve fitting method.
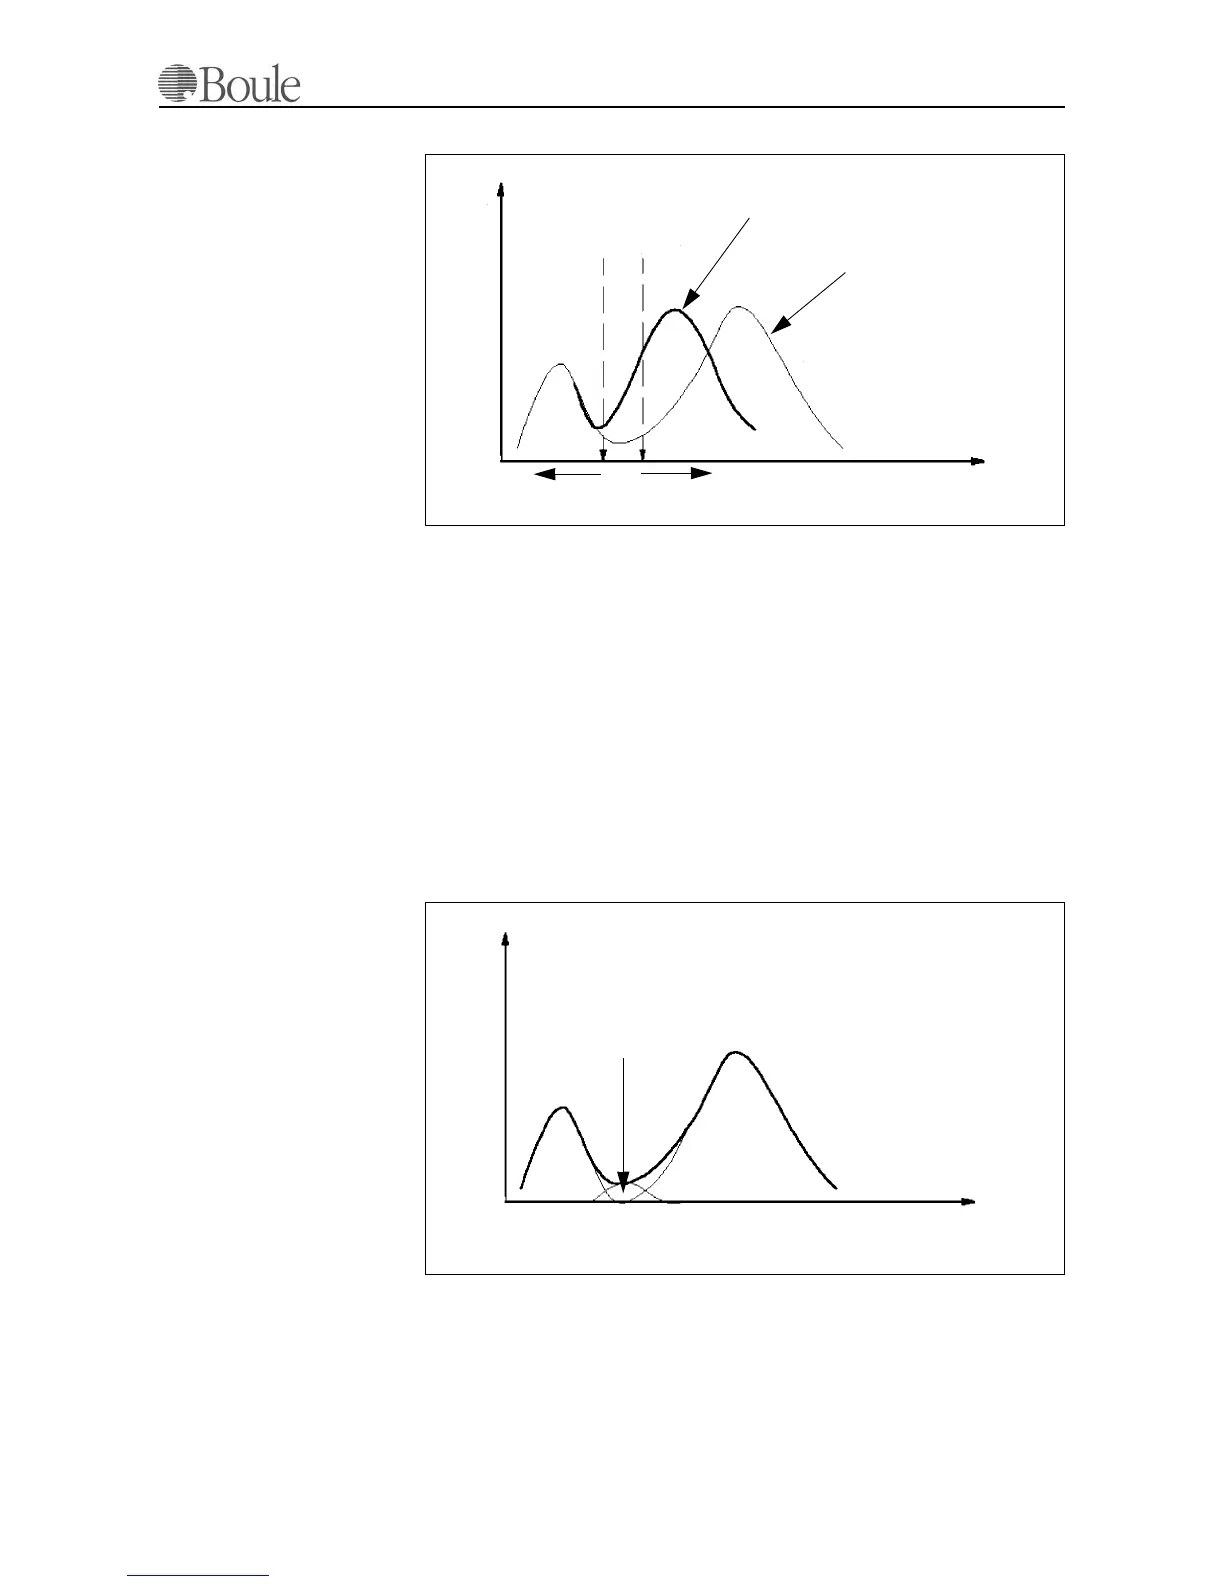
Hence, the software of the instrument is building an artificial matching distribu-
tion around the main populations. To do so, after the analysing process, the in-
strument finds 2 main modes (= peaks) within the total distribution. Then
matching of the 2 main populations takes place including extrapolation to the
base line. The remaining area that was not covered by the 2 main populations is
now classified as being the MID cell area which mainly consists of the Monocytes.
A third population is now calculated, representing this area.
The final picture below consists of 3 curves and will be printed exactly this way.
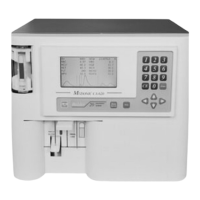
It is obvious that this approach is not dependent on the actual position of the 2
main populations and therefore superior to a system using a fixed discriminator
technology.
1020.tif
fixed discriminators
4 hours old
fresh” blood
LYMF GR A N
Volume (fl)
n
1021.tif
LYMF
n
GRAN
MID cells
Volume (fl)