QC and Blood Controls
1156en01 03-11-24 89
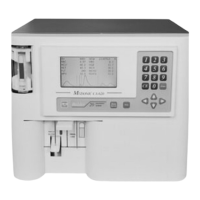
To refine the search and selection criteria of the control, enter menu 7.2.1. See
example below.
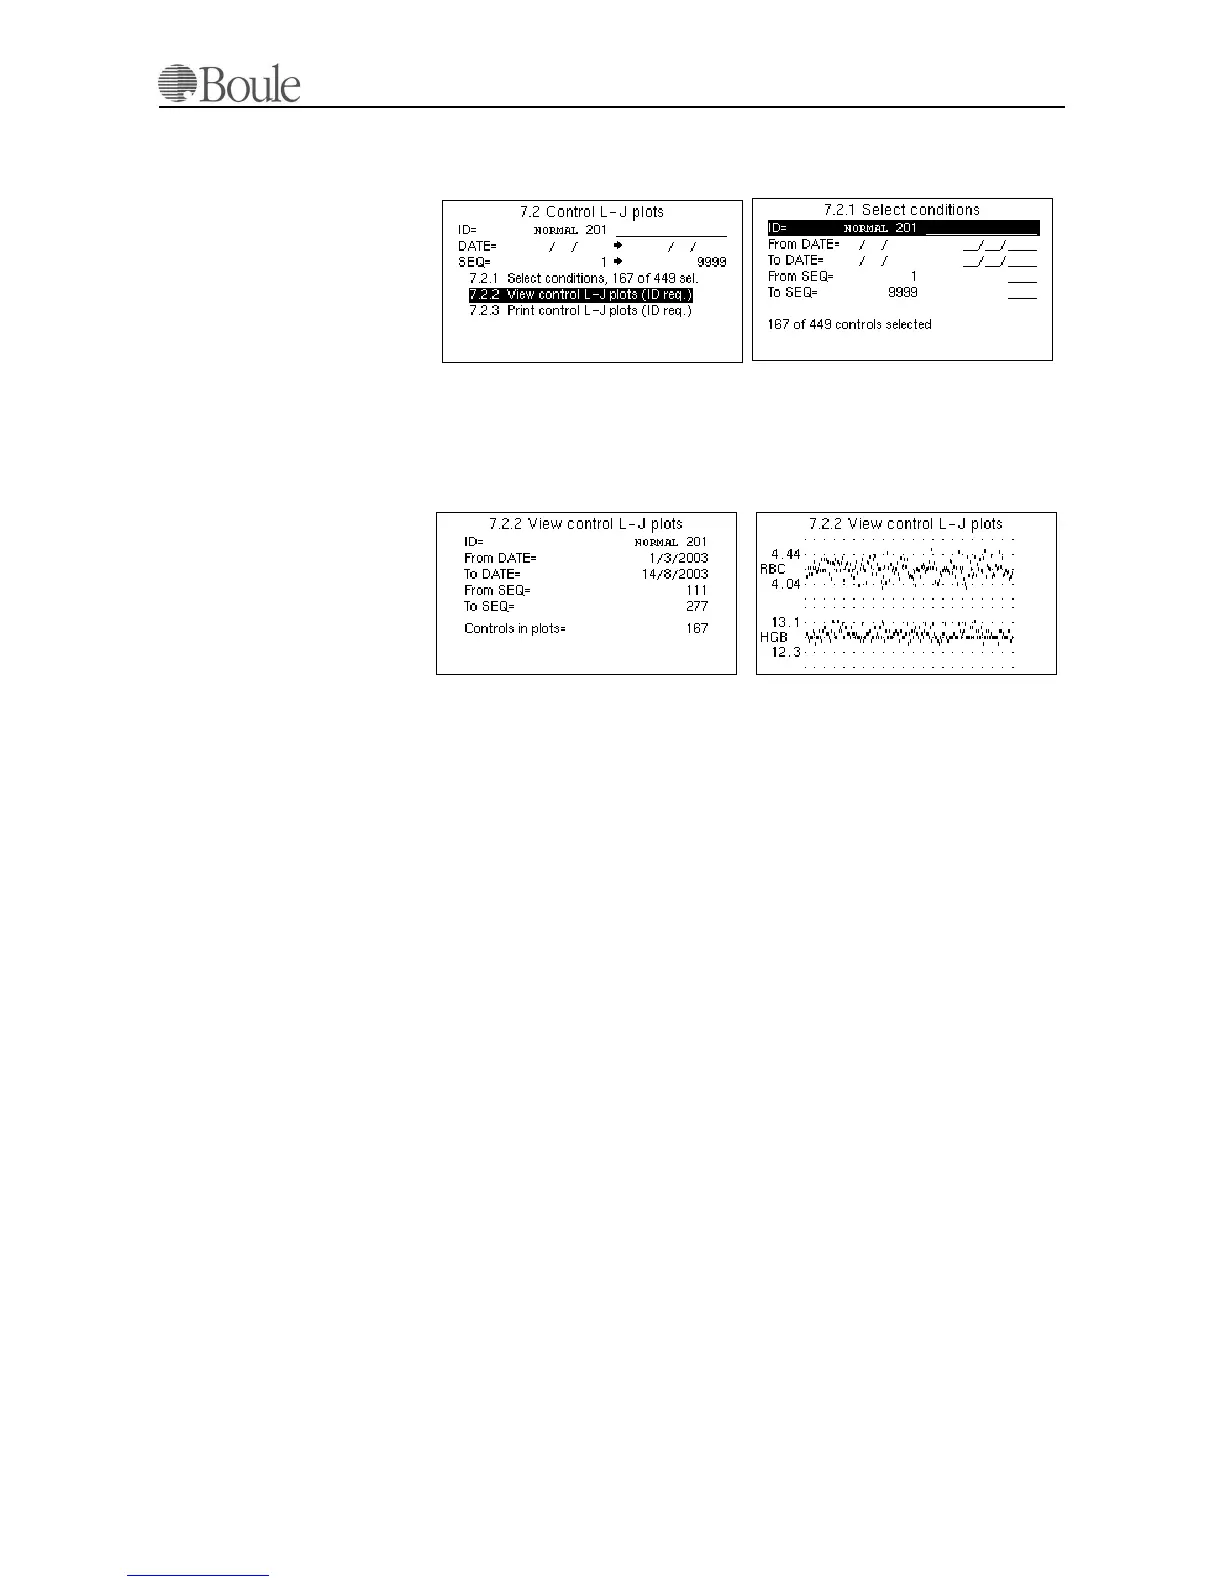
After the select conditions are defined, enter menu 7.2.2 to display an overview
of the blood control. Use the left or right arrow keys to display the L-J plots. See
example below. The L-J plots are displayed for all parameters defined in the con-
trol assay sheet except the WBC differential parameter “MID”.
To print out the L-J plots, go to menu 7.2.3 and press [Enter]. The number of
points printed will be depending on the type and resolution of the installed print-
er.
The figures printed on the vertical scale points to the first plotted horizontal line.
E.g. in the HGB plot in the figure above, the mean value is 12.7. The first hori-
zontal line above the mean value is 13.1 (the max limit for this control) and the
second horizontal line above the mean value is 13.5.
The number of control runs displayed or printed is always counted from today's
date back in time. In the example above, the last run 167 control runs are dis-
played.
Note:
In case a control shows an error or warning flag SE, DE, FD, OF, LO, HI, NG,
TU, TL or TB; the parameter values of such control run will not be included in
the L-J plots.
11.4 Initialization and Use of X-B Function
The X-B function in the CA620 follows strictly the Bull algorithm for the param-
eters MCV, MCH and MCHC.
The above parameters should not drift as a function of time within a large patient
population. The recommended range setting is +/- 3% from the expected mean
value of these parameters.
1164en.gif
1163en.gif
1166en.gif
1165en.gif