QC and Blood Controls
90 03-11-24 1156en01
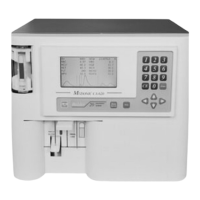
Enter menu 7.4.4 to alter the expected mean values for the MCV, MCH and
MCHC. It is recommended that at least the MCV and MCH parameters are set
to the expected patient mean values with a range of +/- 3%.
To display the X-B Plots, enter menu 7.3 see example below.
By default, all sample data is selected. Refine the display criteria if requested by
entering a date window in menu 7.3.
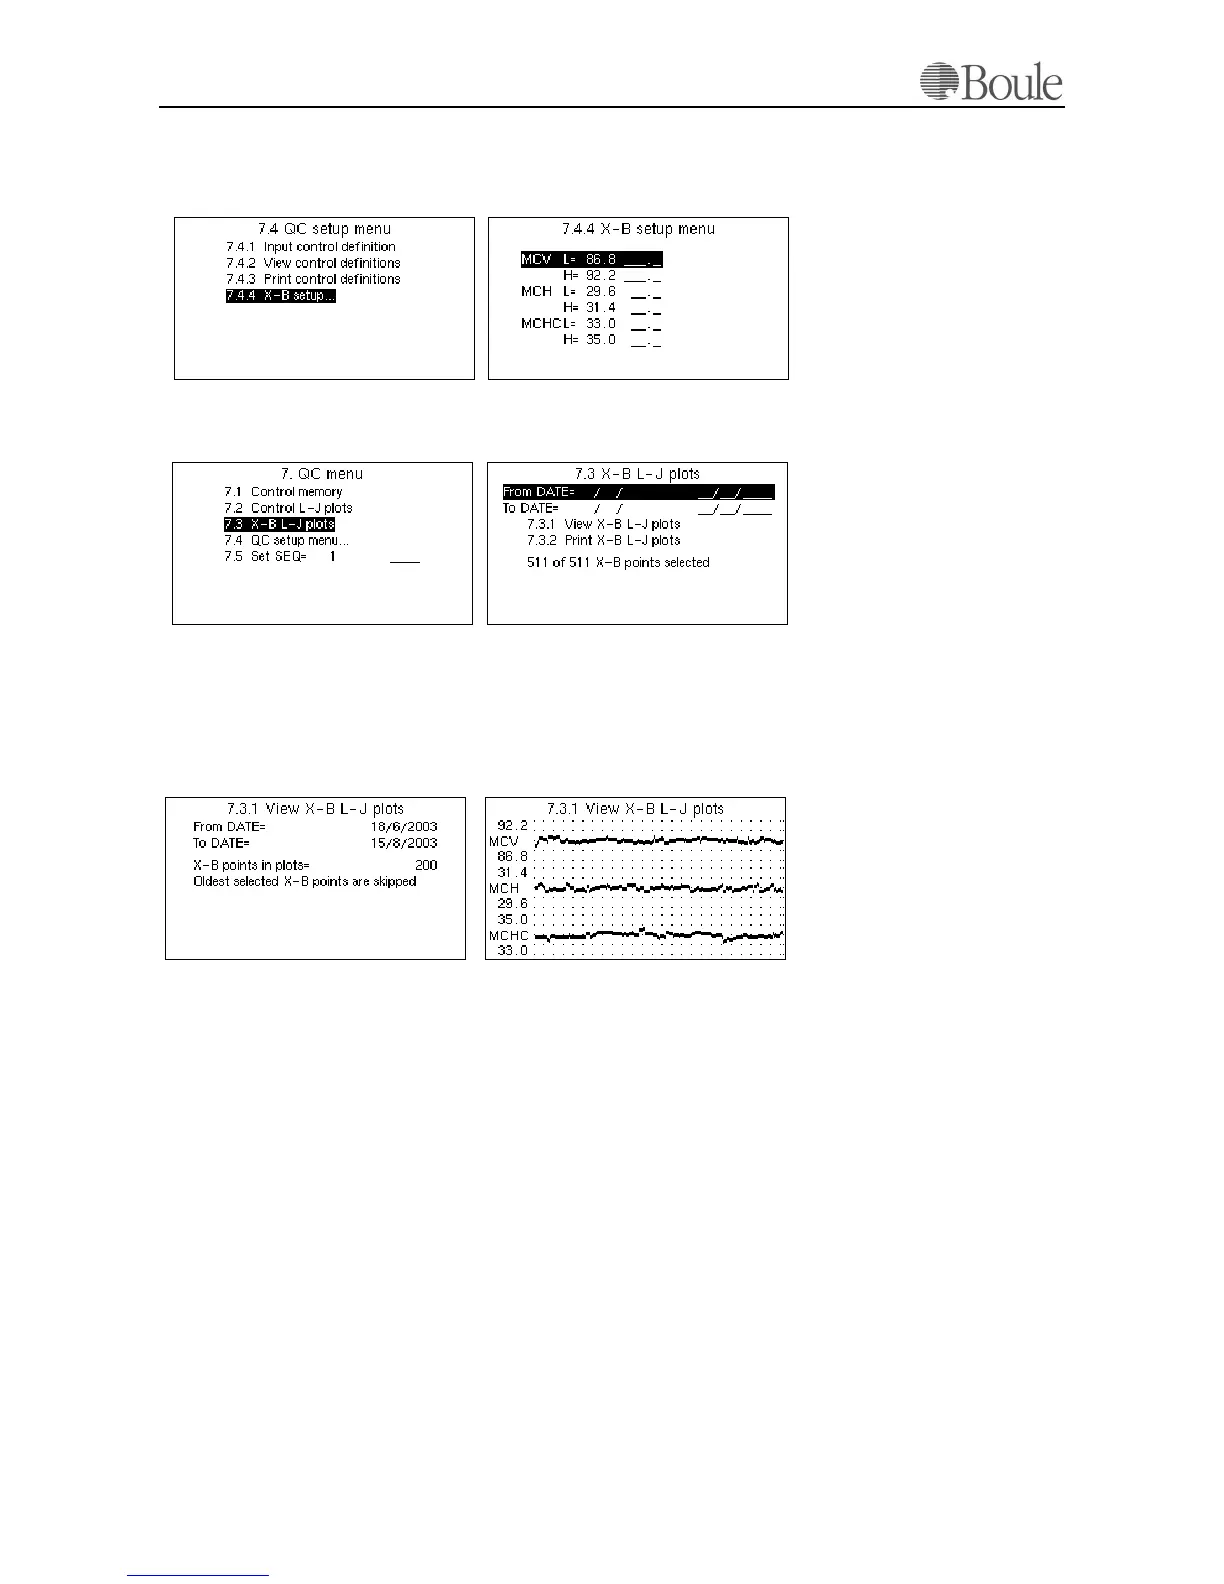
Go to menu 7.3.1 to display the X-B data summary and use the left or right arrow
key to display the plots.
The data points displayed are always from today's date back in time. In other
words, the last data points are displayed. In the example above, 200 points are dis-
played giving the mean of 4000 samples as each point is the mean value of 20
samples.
The figures printed on the vertical scale points to the first plotted horizontal line.
E.g. in the MCHC plot in the figure above, the mean value is 34.0. The first hor-
izontal line above the mean value is 35.0 (the max limit set in menu 7.4.4) and the
second horizontal line above the mean value is 36.0.
Go to menu 7.3.2 and press [Enter] to printout the X-B Plots. The number of
points printed will be depending on the type and resolution of the installed print-
er.
Note:
Samples with an error or warning flag SE, DE, OF, LO, HI, NG, TU, TL or TB
are not included in the X-B Plots.
1168en.gif
1167en.gif
1170en.gif
1169en.gif
1172en.gif1171en.gif