37
Meter Operations 3.4.8 3.4.9
3.4.9
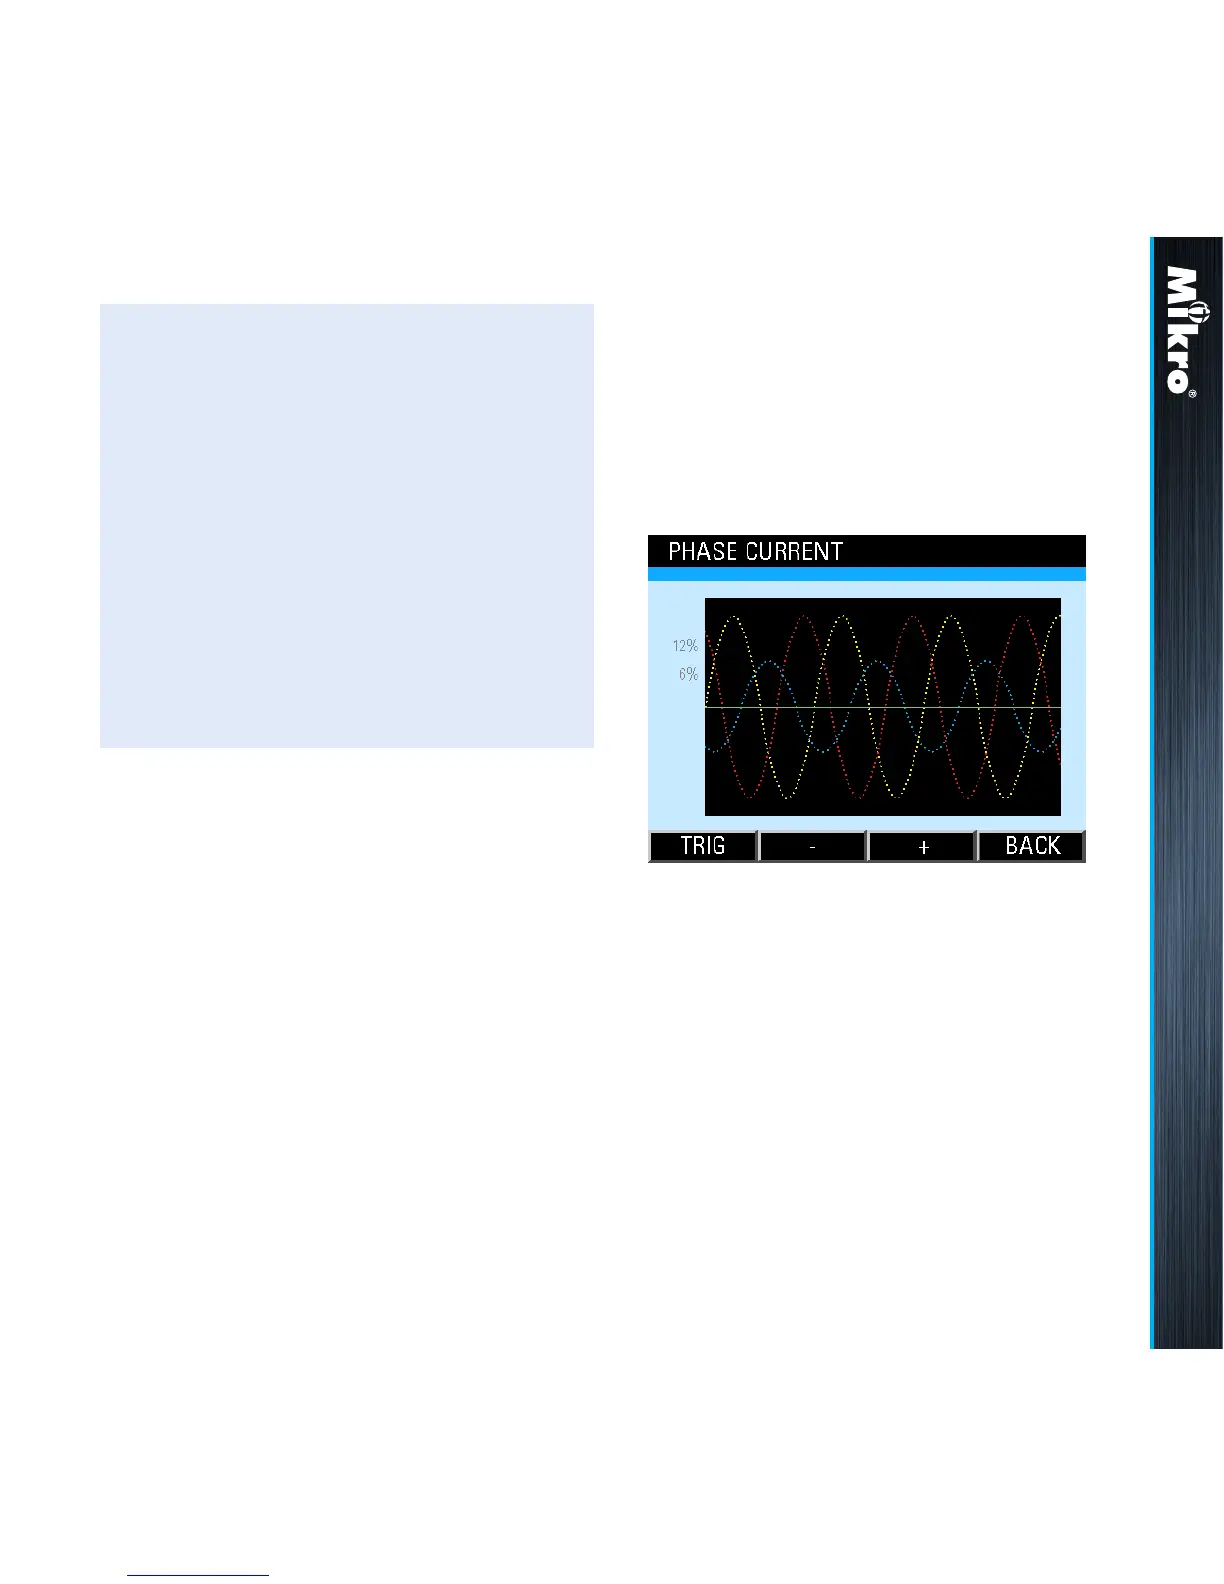
CurrEnT waVEforM
The Current Waveform page shows the current
waveform of all phases as shown in Fig 43:
Fig 43 : Current Waveform page
The RED, YELLOW and BLUE traces show
the current waveform of phases L1, L2 and L3
respectively.
The three display zoom levels correspond to a
maximum range of approximately ±20%, ±40%
and ±80% of the rated rms metering current
input (5A).
The time capture span is xed at approximately
65 msec.
TouCH BuTTon funCTions:
• touch any one button (F1, F2, F3 or F4) once
to view the current harmonics content of
phase L2.
• to view the current harmonics content of
phase L3, touch any button (F1, F2, F3 or
F4) once more.
• to return to the CURRENT sub-menu., touch
any one button (F1, F2, F3 or F4) one more
time.