5-34 Image Optimization
Here are three types of curves to perform the quantitative analysis:
Velocity-time curve;
Strain-time curve;
Strain rate-time curve.
Strain: Deformation and displacement of the tissue within the specified time.
Strain rate: speed of the deformation, as myocardial variability will result in velocity gradient,
strain rate is used commonly to evaluate how fast the tissue is deforming.
Procedures:
1. Scan the image with the moves of myocardium on, freeze the image and select the scan scope, or
open the image which includes the myocardium moves already.
NOTE:
The current image (in frozen state) and the saved image can be used in the quantitative
analysis.
Only after the user chooses the image review, the quantitative analysis is available. If the user
chooses the static image (only one frame), the quantitative analysis is not available.
2. Tap [TDI QA] or press the user-defined key <TDI QA> to enable the function.
3. Mark the interested myocardium area.
4. Select the curve: tap [Speed], [Strain] or [Strain Rate].
5. Save the curves, and export the curve data, parameter data.
6. Exit the quantitative analysis.
Tap [Exit].
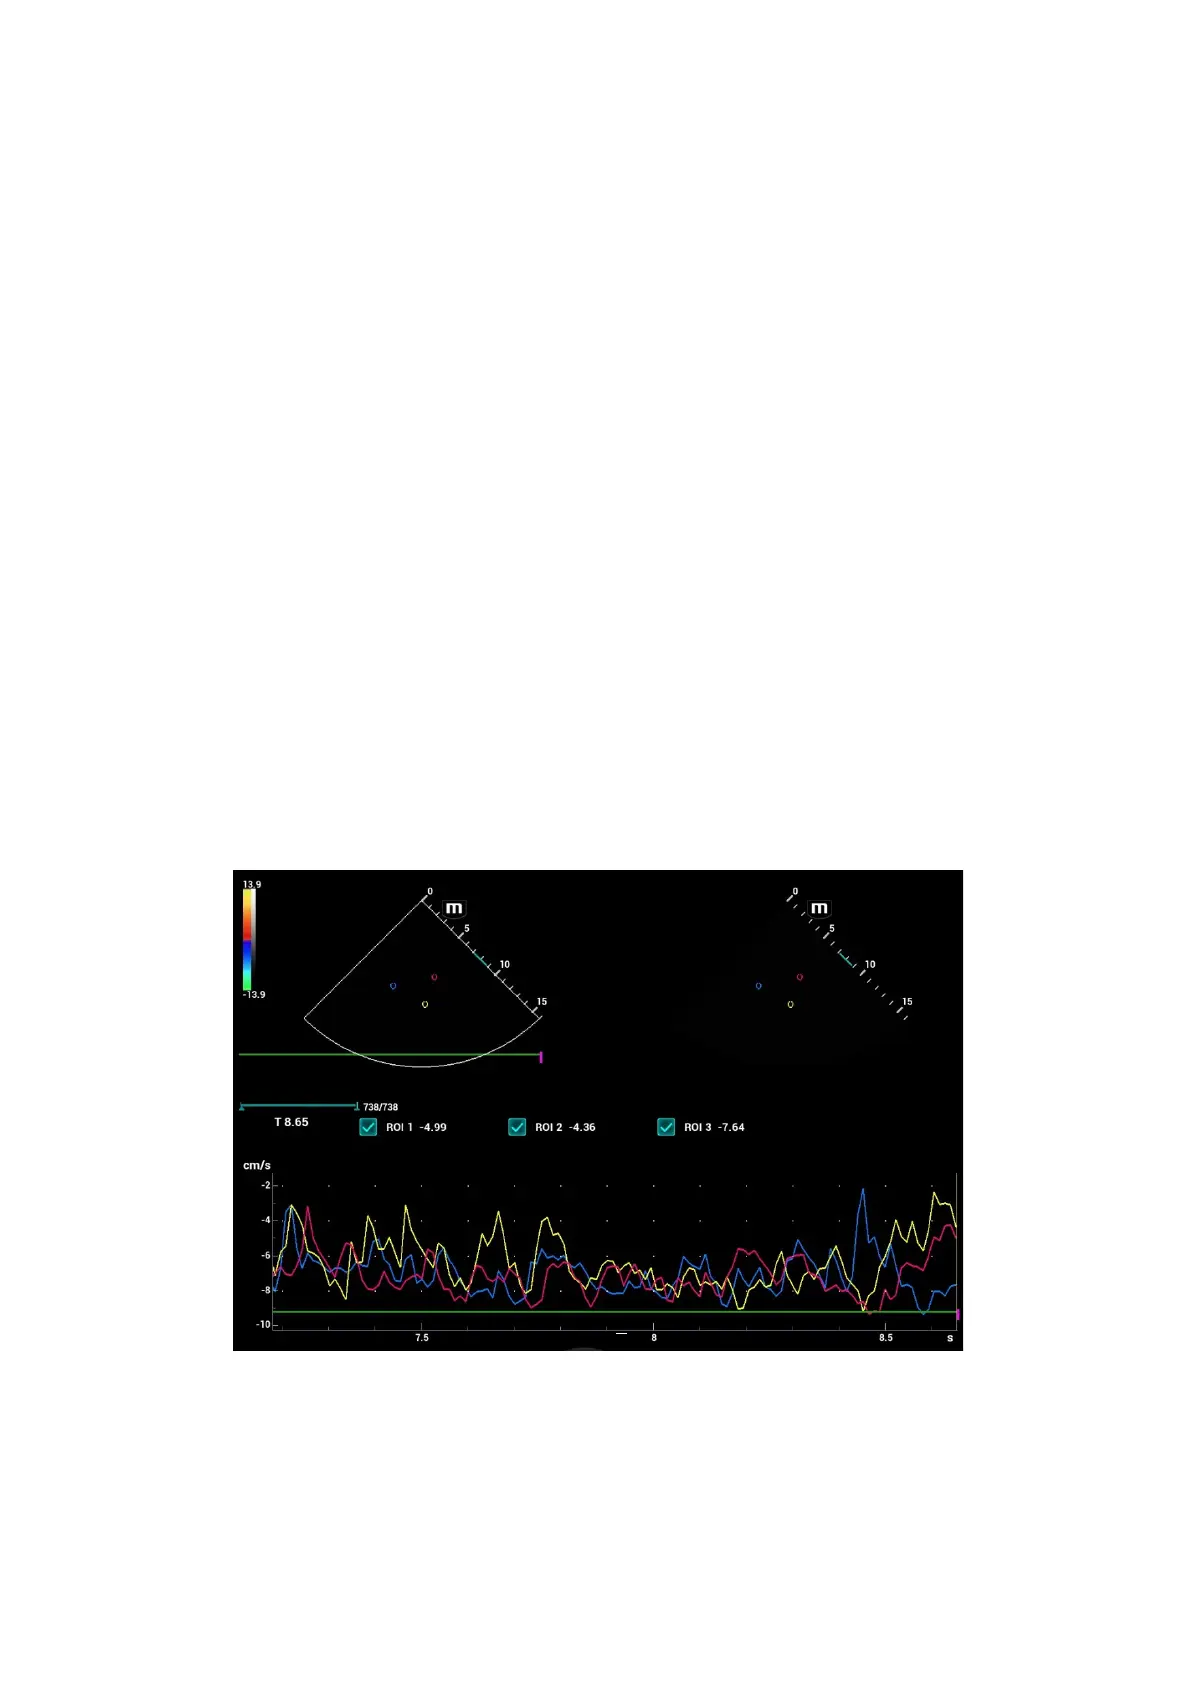
5.10.4.1 Screen Display of TDI Quantitative Analysis
Quantitative analysis display (taking velocity-time curve as the example)
1---TDI review
Sampling area: indicates the sampling position of the curve. The sampling lines are marked with color
numbers. It can mark 8 ROIs at most.
2---2D grey image review
3
4
 Loading...