Image Optimization 5-111
Tap [Edit] on the touch screen to display the cursor. Roll the trackball and press <Set> to re-select the
trace reference points. Move the cursor to the exact boundary position and press <Set> again to set
the right place. Click [Start Tracking] to start tracking again.
6. Tap [Accept & Compute] on the touch screen to calculate and display the curve. Adjust the
parameters if necessary.
7. Tap [Bull’s Eye] on the touch screen to see the result.
8. If necessary, press <Save> key to save the result.
9. If necessary, repeat steps 3-8 to track the next section.
The screen displays the result of the current section, and the bull’s eye graph shows the
average value of all the tracked sections.
10. Tap [Data Export] on the touch screen to export analyzed data.
11. Ta p [Exit] on the touch screen.
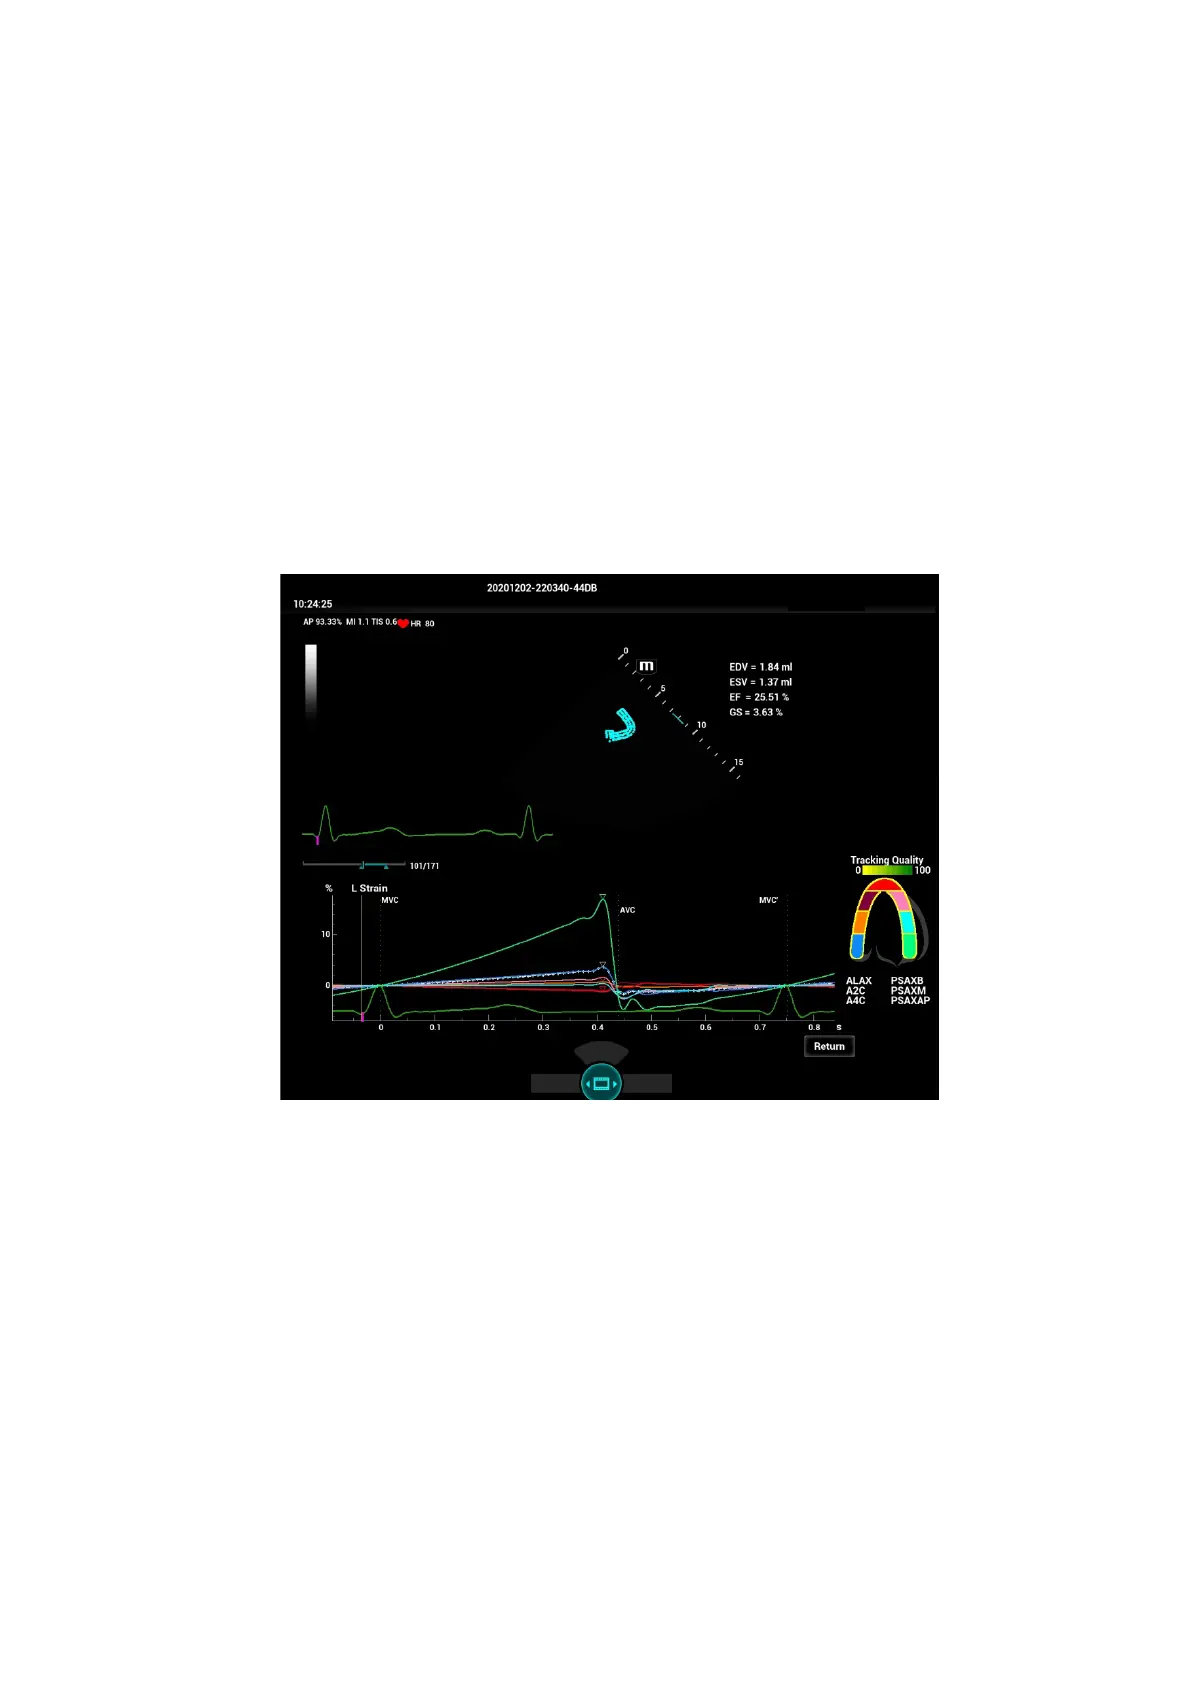
5.16.2 Screen Display of Tissue Tracking QA
1—Displays image used to generate trace curve
2—Displays ECG trace
3—Displays measurement and calculation results:
EDV:Maximum value of the end diastolic volume during the trace.
EDA:Maximum value of the end diastolic area (Left Ventricular) during the trace.
ESV:Maximum value of the end systolic volume (Left Ventricular) during the trace.
ESA:Maximum value of the end systolic area (Left Ventricular) during the trace.
FAC (for short axis section): Fractional Area Change= (EDA — ESA)/EDA
EF (for long axis section): Ejection fraction
HR:Heart rate
Global strain of all segments. Displays when strain rate curve is acquired.
Global strain rate of all segments. Displays when strain rate curve rate is acquired.
Also on Bull’s Eye figure, the system displays TPSD value:
Time to Peak Standard Deviation (TPSD):
1
4
5
 Loading...