Image Optimization 5-115
Circumferential Rotation Rate curve
The X-axis represents time (s);
The Y-axis represents rotation
(Deg/s).
Torsion & Torsion Rate Curve
The system provides left ventricular torsion data based on short axis sections of PSAX AP and PSAX B.
Torsion is acquired by calculating difference of apex and base of the heart.
Torsion=PSAX AP Rot.-PSA XB Rot.
The X-axis represents time (s);
The Y-axis represents torsion by time (Deg/s).
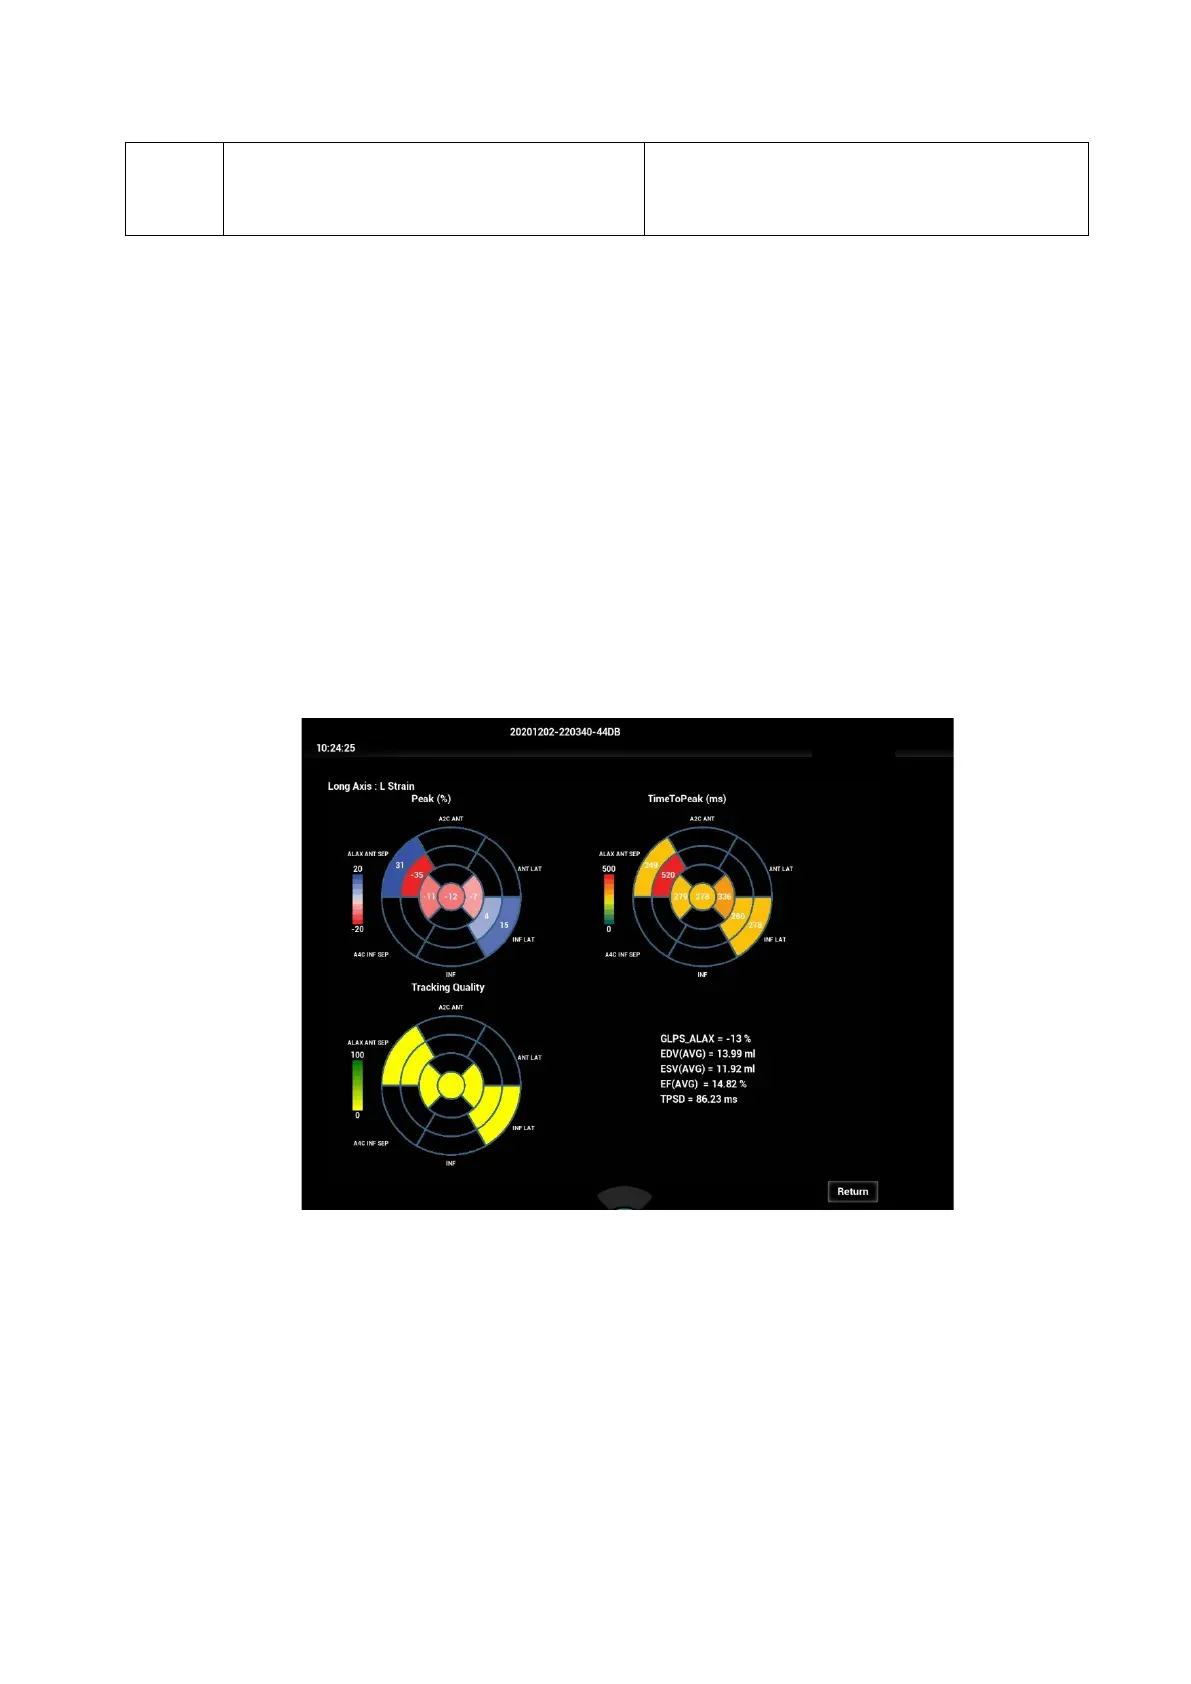
5.16.6 Bulleye
After tracking, the system can display Bull’s Eye graph, so as to judge reverse movement or scope of
myocardium.
1. Tap [Bull’s Eye] on the touch screen to turn on the function:
You can acquire:
Time to peak value and peak value of the 17 segments (similar to 16 segments);
Display measurement result EDV/ESV/EF/TPSD.
2. Rotate the knob under [Parameter] on the touch screen to see different parameter bull’s eye graph.
"-" will display in the table to indicate those segments that are not well tracked.
5.16.7 Measurement/Comment
Under tissue tracking QA mode, only Time measurement is available. For details, please refer to
Operator’s Manual [Advanced Volume].
Comments and Body Mark operations are the same as in other modes.
5.16.8 Data Export
The system provides data exporting function, so that you can export calculation result for analysis (for
instance, SPSS analysis).
 Loading...