5-144 Image Optimization
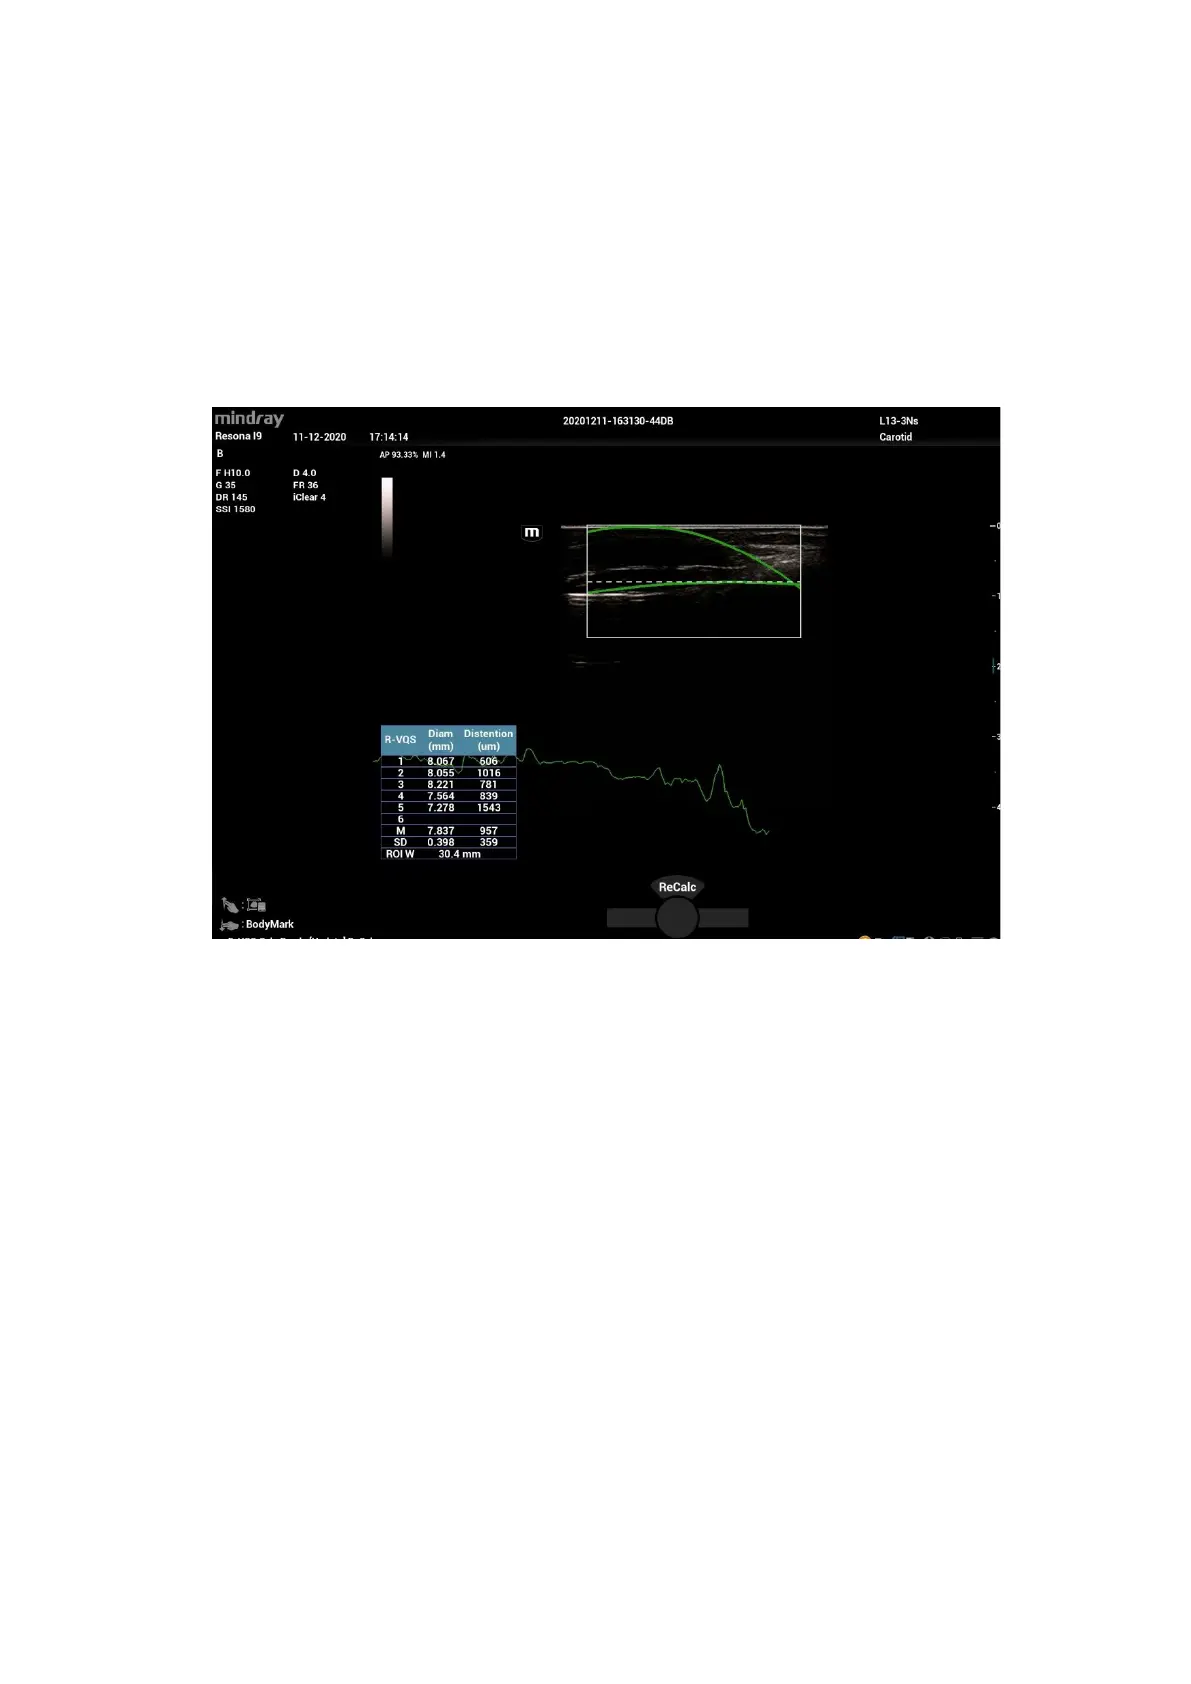
3. Tap [Start Calc] to start tracking. Upper wall and lower wall are marked by green line in the ROI
box.
Motion curve of vessel walls display under the image in real time. 6 cardiac cycles are calculated in
total with each results display in the result window on the left synchronously.
Where,
Dist = [maximum diameter within 1s] – [minimum diameter within 1s]
Diam: Vessel diameter refers to maximum diameter within 1s.
6 R-VQS (RF-data based quantification on arterial stiffness) values (6 cardiac cycles are calculated
in total), standard deviation SD and ROI length will be displayed in the result window on the left.
4. Tap [Stop Calc] or press <Freeze> to freeze the image and stop updating motion curve and result
data.
5. Roll the trackball to review the cine file and select desired frame. Tap [Accept Result] to send the
data in the result window to the report. Save the single-frame and multi-frame image if necessary.
Tap [ReCalc] to recalculate R-VQS.
6. Tap [Report] on the touch screen to check report. Only last result data will be saved.
If pressure is entered in the patient information page or the report page, Hardness coefficient and
PWV result will be displayed on the report.
For details about report operation, refer to [Advanced Volume].
Parameter adjusting
Speed
Description Adjust refresh speed of vessel wall motion curve.
Operation Adjust through [Speed] on the touch screen.
There are 6 levels of scan speed available, the smaller the value is, the faster
the speed becomes.
Position
Adjust the location of the motion curve upwards and downwards.
 Loading...