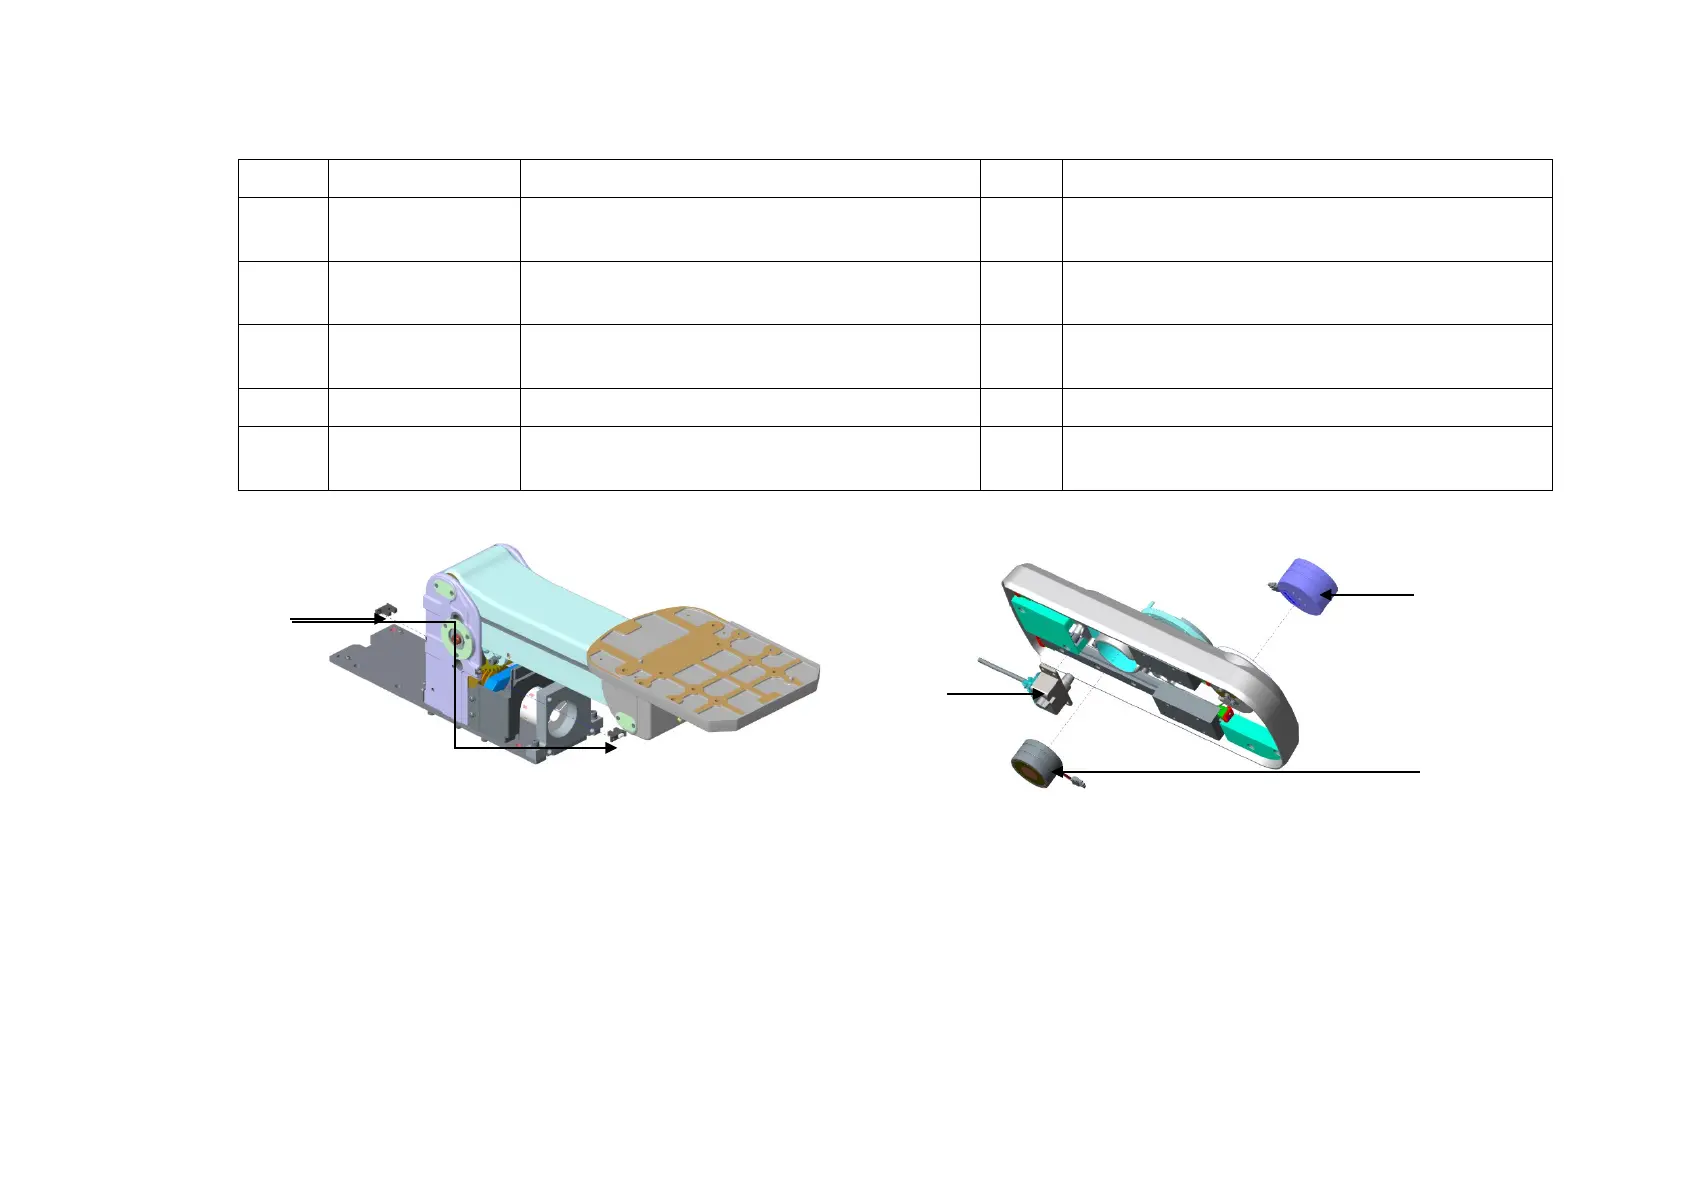
6 - 16 Operator’s Manual
6 Image Acquisition
2. Tap [Velocity A/B/C] on the touch screen. The single point-time curve appears at the bottom of
the screen. (The speed of either point changes with the time. Besides, horizontal axis
represents the time; vertical axis represents the speed. Single point-time curve appears in
white.)
The starting point and the end point of heart rate cycle and heart rate are also displayed at the
bottom of the screen. If necessary, you can tap [Edit HR] to adjust the starting point and the
end point by using the trackball and <Update> button. Press <Set> key to confirm the position,
and the measurement result of HR is updated.
The speed vector graphics appears below the parameter area. Here, Vel and Angle refer to the
absolute velocity and angle of the blood flow at this position. The white arrow indicates the
speed direction of the cursor.
Move the cursor to any position of the blood vessel; the single speed-time curve and the vector
graphics are updated in real time (click [Velocity A/B/C], adjust [Velocity A/B/C] again by
rotating the track ball and pressing <set> key, or press <Clear> key to clear Velocity A/B/C).
3. Press <Cursor>. The trackball indication changes to cine-play indication. Move the trackball to
replay the V Flow cine. The speed and the direction of the vector graphics changes with the
time.
ROI speed-time curve
After the V Flow capturing is completed, a smaller ROI appears inside the original ROI to calculate
the arrangement of spatial speed and the maximum speed-time curve.
Perform the following procedure:
1. Capture the image. Follow steps 1-5, see “6.5.1 Basic Operations”.
2. Tap [Velocity ROI] on the touch screen, rotate the knob under the [ROI Size] on the touch
screen, or rotating the track ball and pressing <Cursor> key to adjust ROI size and position.
1 Vector graphics
1