8 Spectrum Analysis Mode
160 IDA-3106 Narda
8.1 About Spectrum Analysis mode
All the field components in the selected range can be recorded to give an
overview of the detected spectrum or to determine the maximum values in
Spectrum Analysis mode. The extended functions of the device enable
you to perform optimum evaluation of the measured values directly on site.
Marker functions and a peak table are provided for rapid assessment of the
results of spectrum analysis. You can also display the wideband value of the
integrated level for a freely-definable frequency band.
You can use the Delta Spectrum function to define a displayed spectrum as
reference and handle it like a further trace type. Even the smallest changes
can be quickly and accurately determined by taking the difference between
the spectra and the reference.
Spectrogram allows you to display the time characteristic of the signal
strength of a spectrum. The diagram can be displayed alongside the current
spectrum or on its own. RMS, +Peak and -Peak detectors are available.
Results are always recorded and saved for all three detector types.
Spectrum and Spectrogram can be displayed individually or in two
windows one above the other.
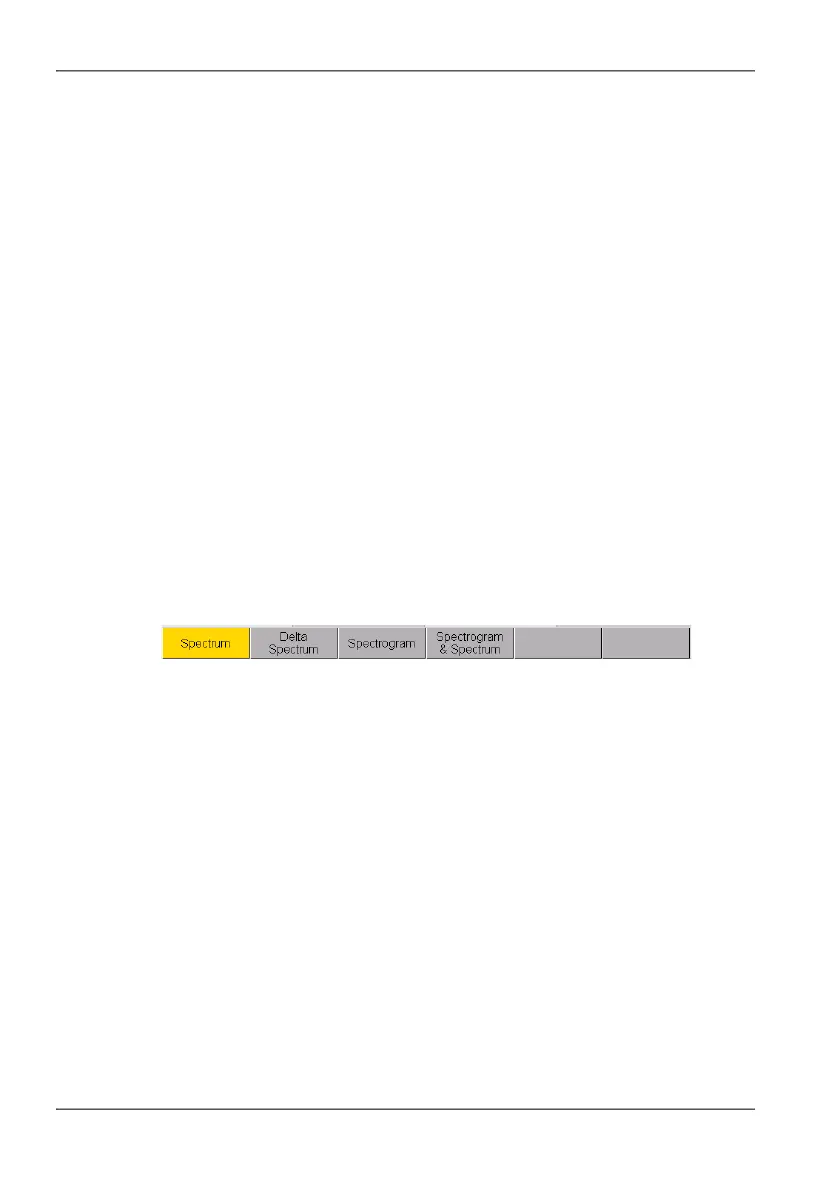
To select a function:
Press the Measurement softkey.
Figure 34: The Measurement menu: The selected function is highlighted in color.