8 Spectrum Analysis Mode
162 IDA-3106 Narda
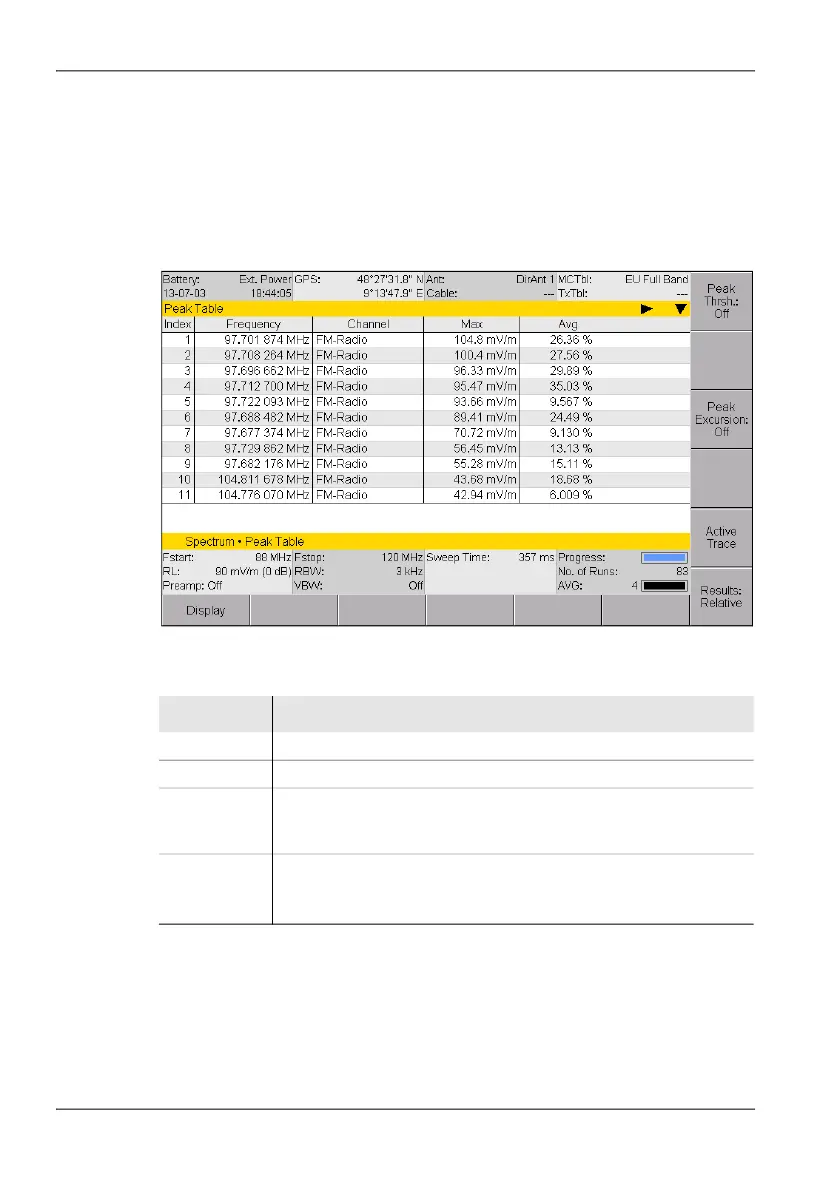
8.2.1 Displaying the peak values (Peak Table)
The highest peaks (up to 50) in the frequency spectrum under consideration
are listed in the Peak Table. These are true peak values.
To open the Peak Table function:
Press the Peak Table softkey.
Figure 36: Peak Table in Spectrum Analysis mode
Column Description
Index Sequence number of the peak (up to 50)
Frequency Frequency value of the peak
Channel/
Transmitter
Channel to which the peak (frequency value) belongs.
If a transmitter table is selected, the transmitter names will be
shown here.
Avg
Max
Trace types
The columns displayed depend on the trace types that have been
selected (see next section).