8.4 Displaying the time characteristic (Spectrogram)
Narda IDA-3106 169
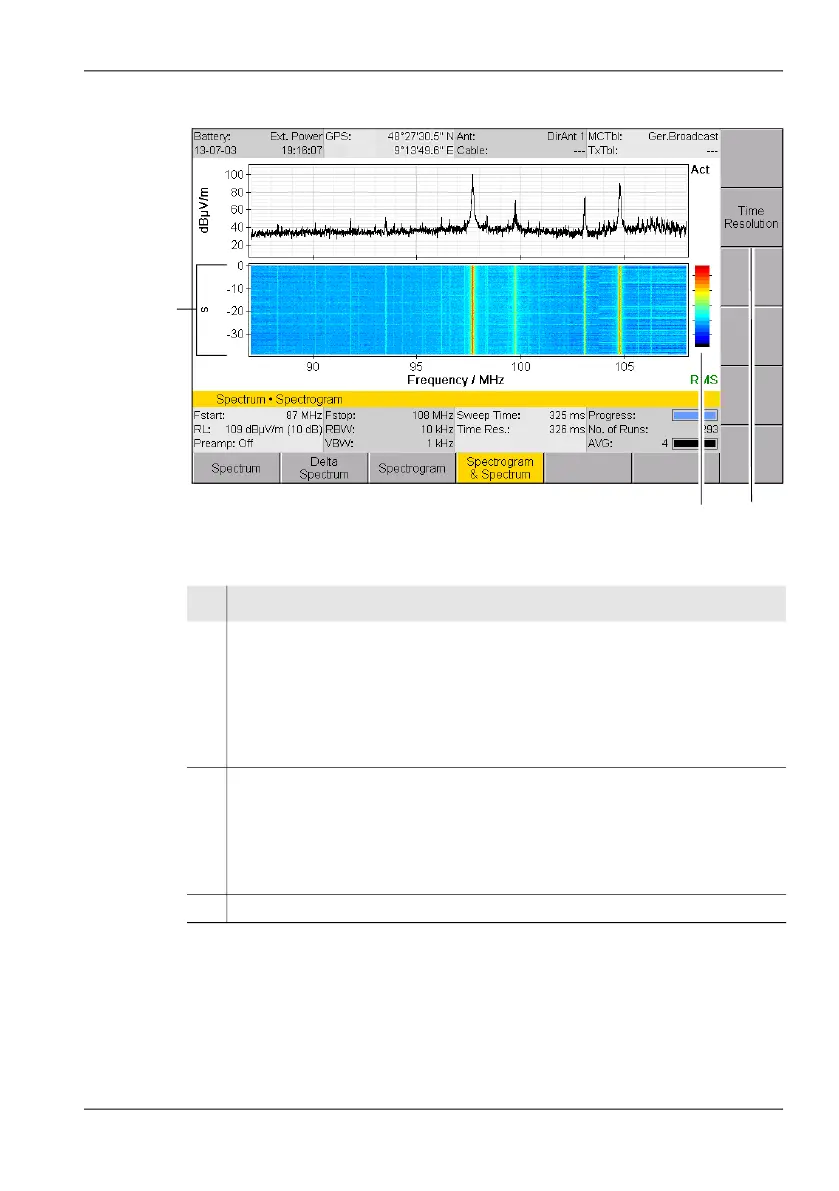
Figure 40: Spectrogram in Spectrogram & Spectrum display mode.
1
2
3
No. Function / Explanation
1 Spectrogram
0 is the current value; the values along the Y axis show the elapsed time in
seconds. There are 400 lines available. The total range that can be displayed
depends on the Sweep Time and the selected time resolution (see Changing
the time resolution (Time Resolution) on page 170). If the entire time range
cannot be shown in one diagram, the spectrogram marker function allows you
to scroll back to older values (see The Spectrogram Marker on page 171).
2 Colored display of the signal level in the spectrogram.
The dashes next to the color scale correspond to the subdivisions of the Y axis
in the Spectrum window, i.e. 10 to 90 dBµV/m in the example shown.
You can adjust the colored display using the Y-Scale Range and Y-Scale Ref
parameters in the Display menu (see Adjusting the Y axis (Y-Scale)
on page 105).
3 Softkey for selecting the Time Resolution.