9-1 Controller Link Network Diagnostic Tool
9-1-1 Diagnostic Functions and Flowcharts
9-1 Controller Link Network Diagnostic Tool
9-1-1 Diagnostic Functions and Flowcharts
Introduction
The Controller Link Network Diagnostic Tool can perform a variety of diagnostic
operations, such as checking the operating status of a Controller Link network made
up of computers and CS/CJ-series, CVM1/CV-series, and C-series nodes, checking
for errors in the node settings, and collecting all of the nodes’ error status and error log
information.
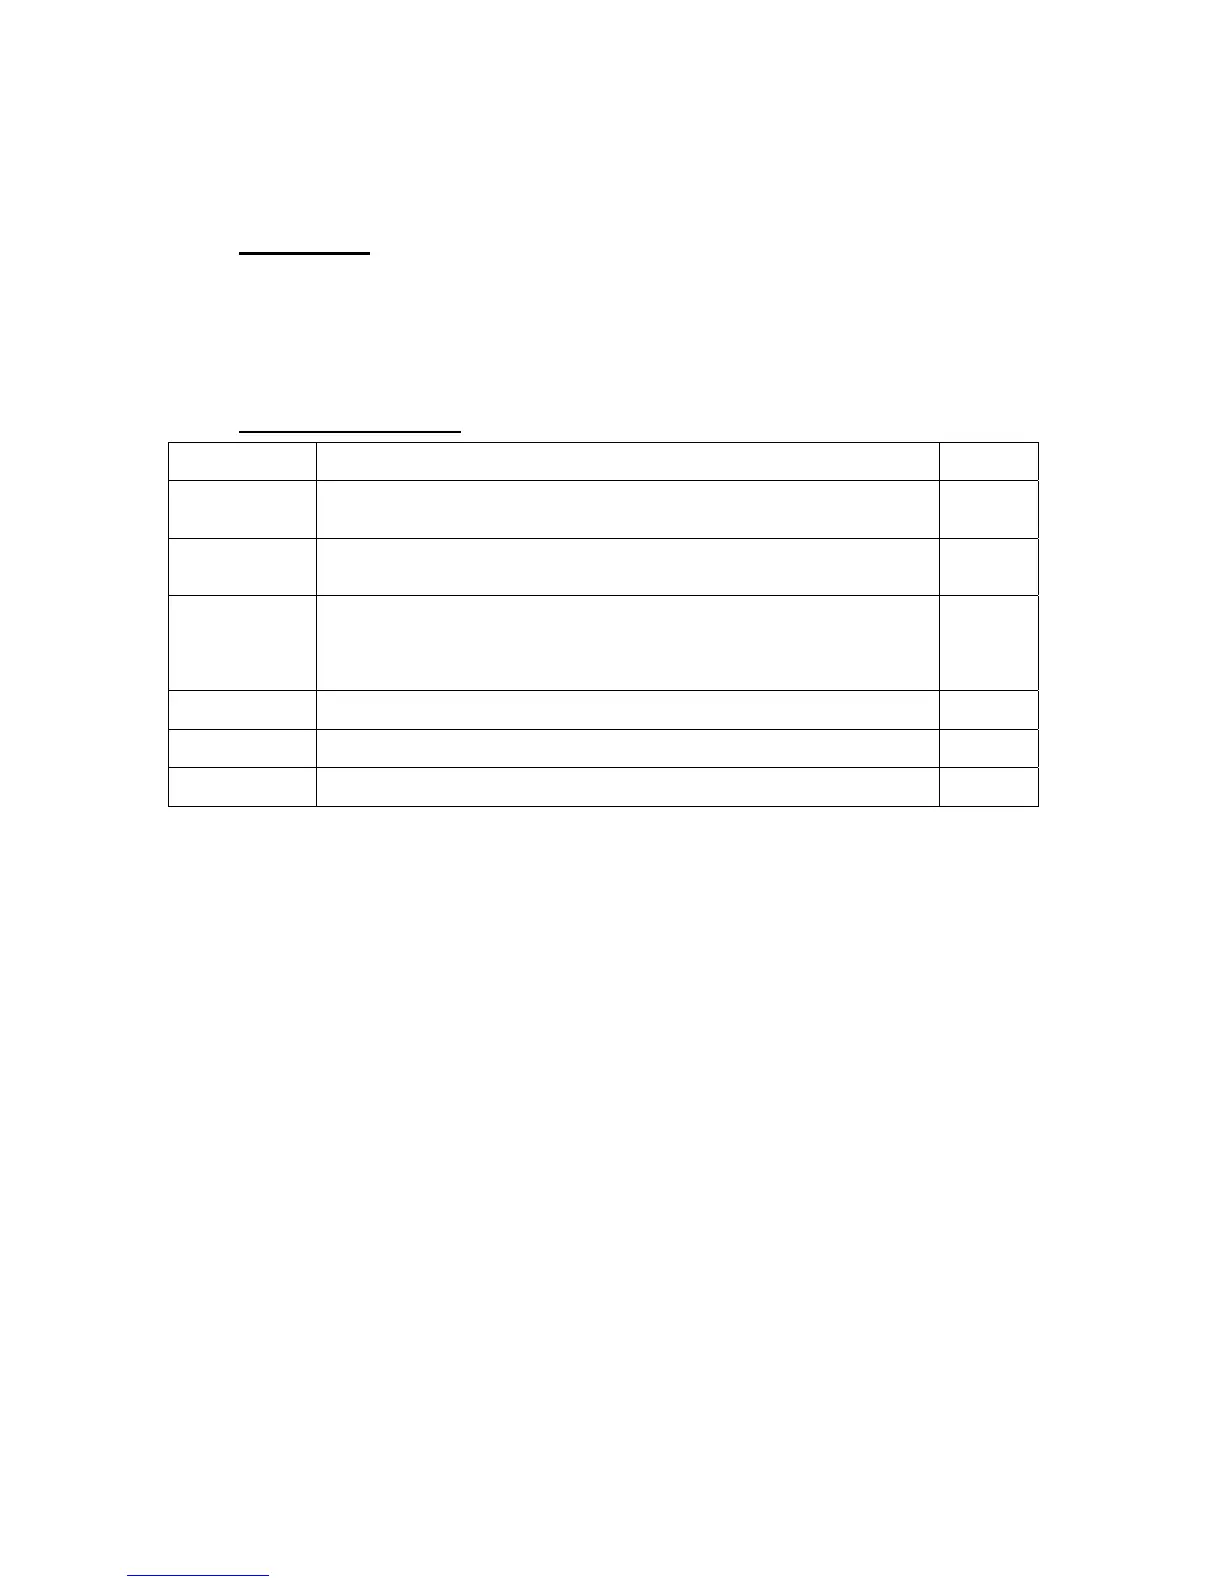
Diagnosis Functions
Diagnosis
function
Description Page
Network Status • Displays a list of the nodes participating in the specified network.
• Diagnoses the operating status of the CPU Units and Controller Link Units/Boards
and displays information on any errors that have occurred.
9-5
Node Settings • Reads the settings (e.g., DM Parameter Area settings) for all nodes participating in
the specified network and diagnoses the integrity of the overall network.
• Diagnostic results are displayed in three levels: Errors, Warnings, and Information.
9-11
Disconnections • For optical ring networks in token ring mode, displays all nodes in the specified
network in the order they are physically connected.
• If the cable has been disconnected, the locations of disconnections are displayed.
• Displays a list of the disconnection counters measuring each node: Number of
node/network separations, number of network disconnections, etc.
9-14
Transmission
Status
• Displays the transmission status counters for all nodes in the specified network. 9-17
Node Status • Displays the current error status and error log for the specified node (CPU Unit or
Controller Link Unit/Board).
9-18
Collecting Error
Logs
• Collects the error status and error logs for all nodes in the specified network and
saves them to a file.
9-21
9-2
 Loading...