Inspecting with the Sensitive Search Inspection Item
FQ2 User’s Manual
4
Setting Up Inspections
119
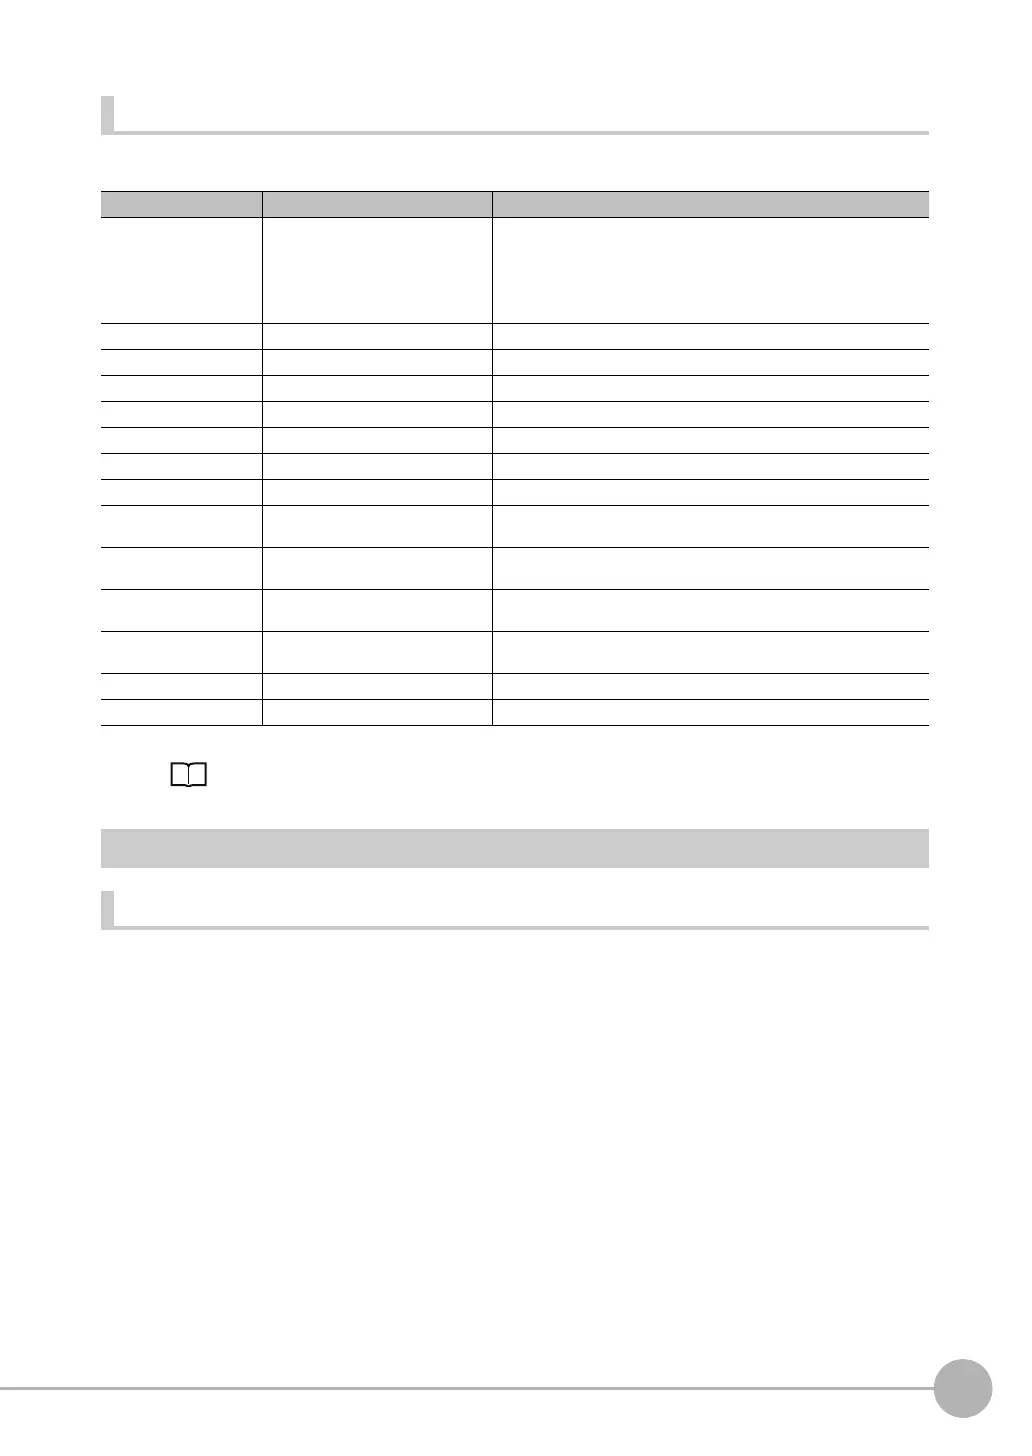
Measurement Data That Can Be Logged
The following values can be logged as measurement data.
* When logging data is output, the data is output in the order of the above table.
7-6 Logging Measurement Data and Image Data: p. 208
Errors
Errors in Teaching
A teaching error message will appear if the contrast of the image within the model registration region is too low.
Select a region with a larger contrast between light and dark areas compared to the region that was registered
as the model and re-register it as the model.
Parameter Range of value Description
Judgement −2: No judgement (not measured),
0: Judgement is OK,
−1: Judgement is NG,
−13: Teaching not performed error,
−14: Figure not registered error,
−15: Out of range error
This is the judgement result of the sensitive search.
Correlation 0 to 100 Correlation
D deviation 0 to 221 Density deviation
Position X −99,999.9999 to 99,999.9999 This is the X coordinate of the position where the model was found.
Position Y −99,999.9999 to 99,999.9999 This is the Y coordinate of the position where the model was found.
Angle −180 to 180 This is the angle of the position where the model was found.
NG sub-region 0 to 100 This is the number of NG sub-regions.
Sub-region number 0 to 99 This is the number of the regions with the lowest correlation.
Sub-region pos. X (sub-
region number (X))
0 to 9 This is the column number in the X direction of the output region.
Sub-region pos. Y (sub-
region number (Y))
0 to 9 This is the row number in the Y direction of the output region.
Sub-region position X −999,999,999.9999 to
999,999,999.9999
This is the X coordinate of the sub-region that was found.
Sub-region position Y −999,999,999.9999 to
999,999,999.9999
This is the Y coordinate of the sub-region that was found.
Correlation (sub-region) 0 to 100 Correlation
Deviation (sub-region) 0 to 221 Density deviation