Section 2 NS Series Functions 2-15 Data Logs
2-362
NS Series Programming Manual
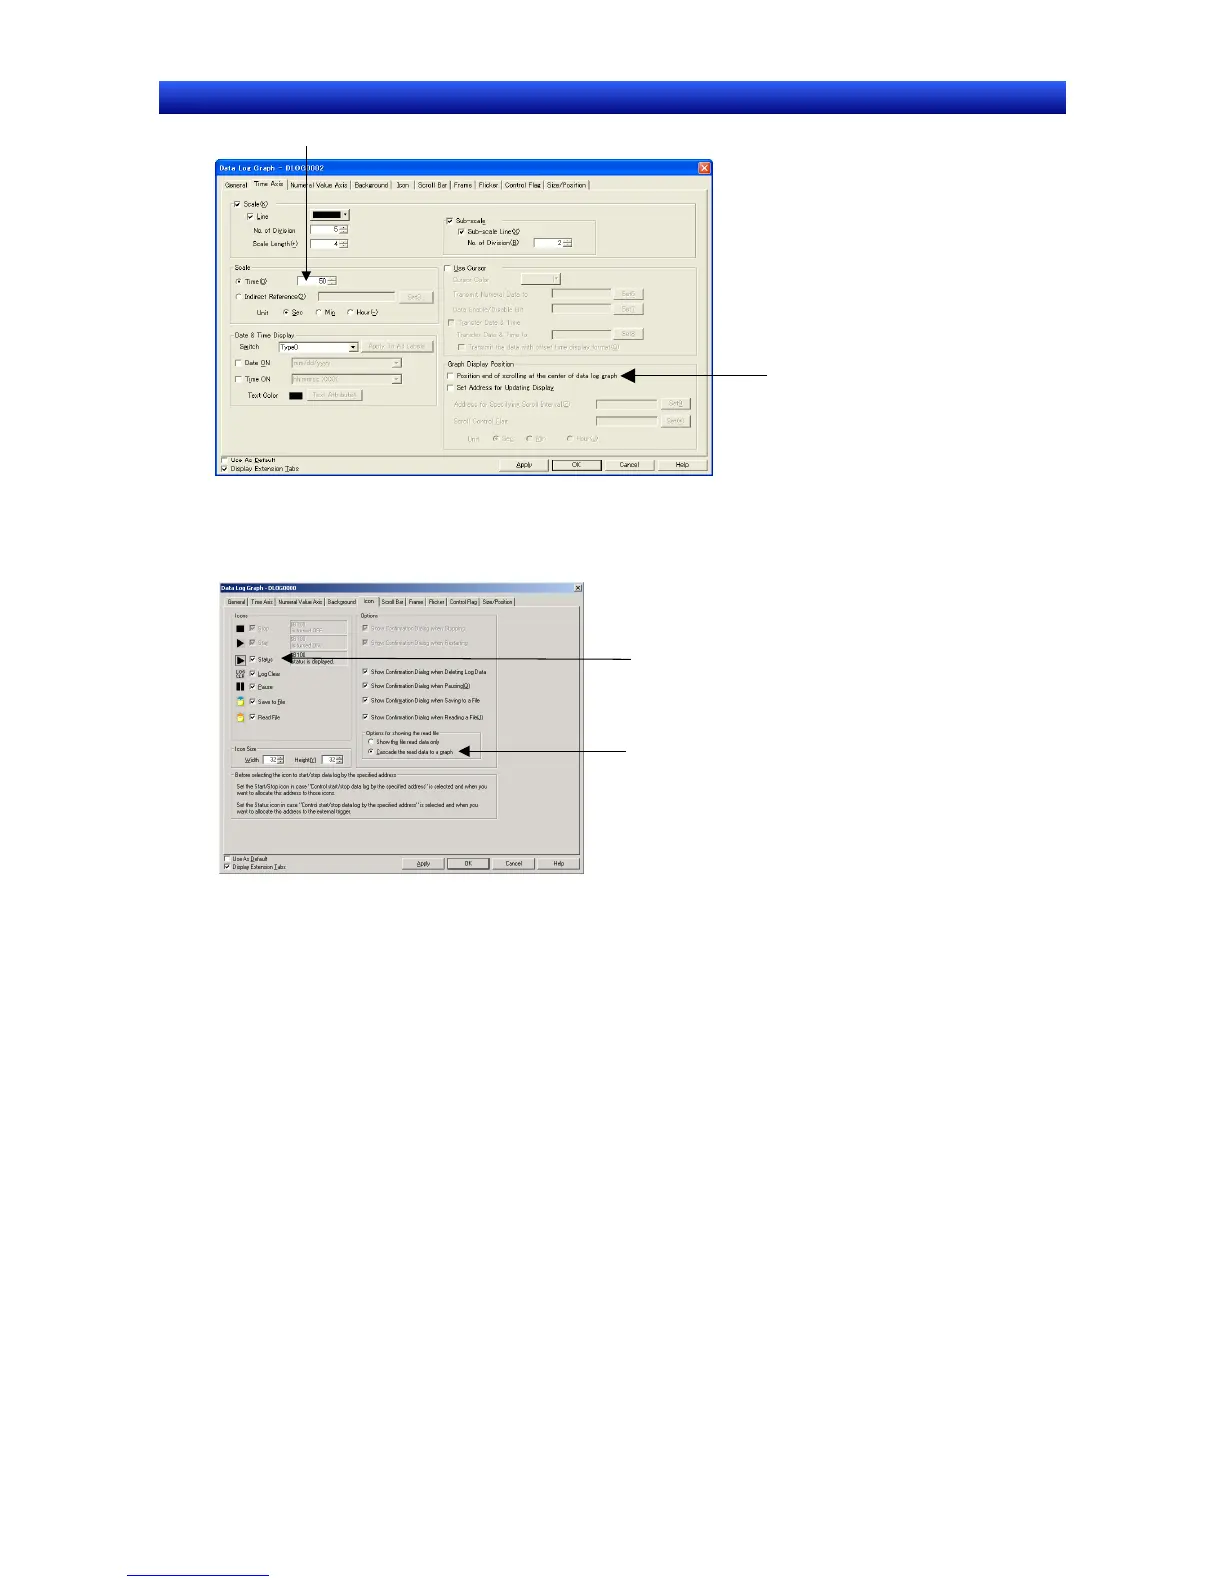
6. Set the amount of the logging period to be displayed at one time.
7. Select Position end of
scrolling at the center of
data log graph
.
8. Display the Icon Tab Page.
9. Select Status under Icon.
10. Select Cascade the read data to a graph under Options.
10. Select Cascade the read data to a graph.
9. Select Status.
11. Click the OK Button and transfer the project to the NS hardware.
 Loading...