51
This will create a file named COMXX-LBX-MM_DD_HHHH_log in the record directory, where “XX” is the
number of communication port (identical to the one appearing in the laser list), “MM” is the current month,
“DD” the current day and “HHHH” the current time.
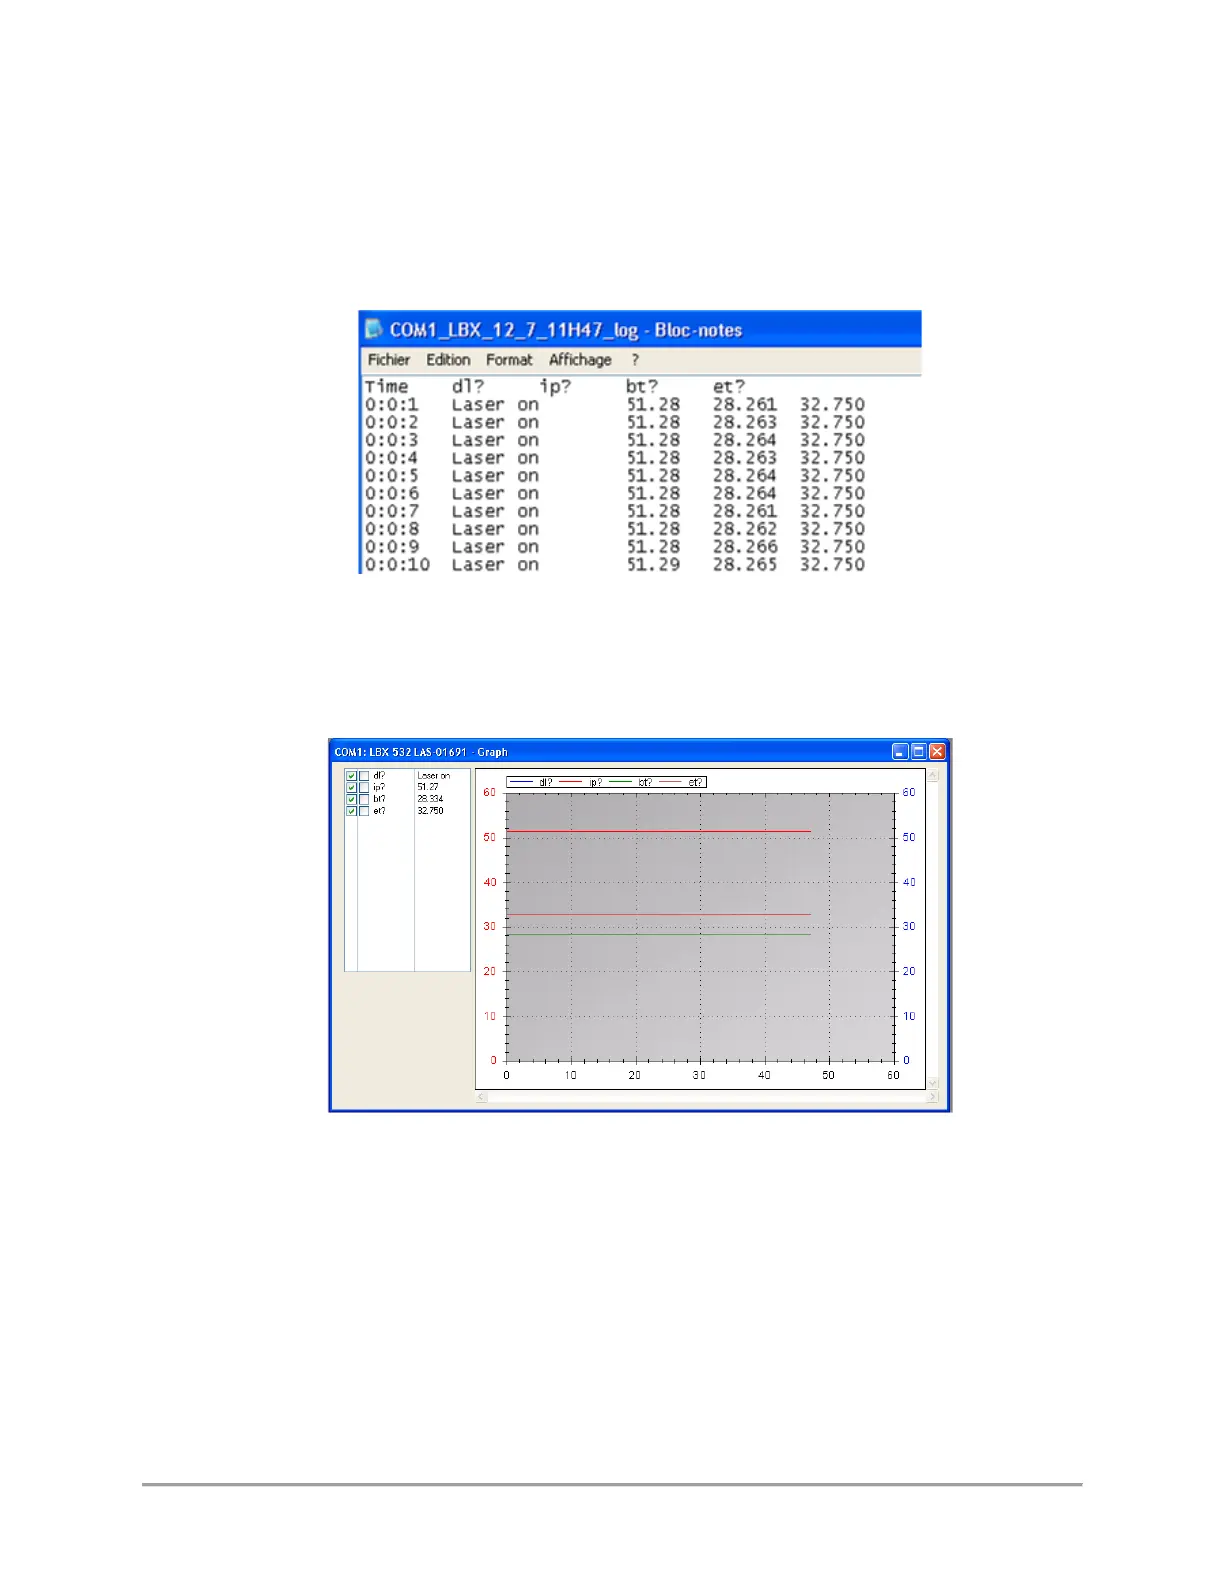
The syntax of this record is plain text, so that it can be opened by any text editor as in the following
example:
It is also possible to visualize the logged parameters in real time using the “Graph” button in the command
panel. This will open a separate window displaying the recorded parameters as curves against time (on
abscissa):
The frame on the top left lists the parameters that may appear on the graph, and their current value.
Here are some basic controls:
- Tick on the boxes left to each of the parameters polled to make its curve appear the left axis, or on
the right axis or to remove it from the displayed curves.
- Use the left mouse button inside the curve frame to draw a zoom window.
- Use the right mouse button inside the curve frame to open a dedicated menu for zoom and display
- Focus function: leave your mouse on a single curve to see the values (coordinates) of the nearest
point belonging to this curve