Advanced settings
28
7 Advanced settings
7.1 "Graph" screen
Access the "Graph" screen by pressing .
7.1.1 Description
Monitoring and recording the leak rate and/or the inlet pressure.
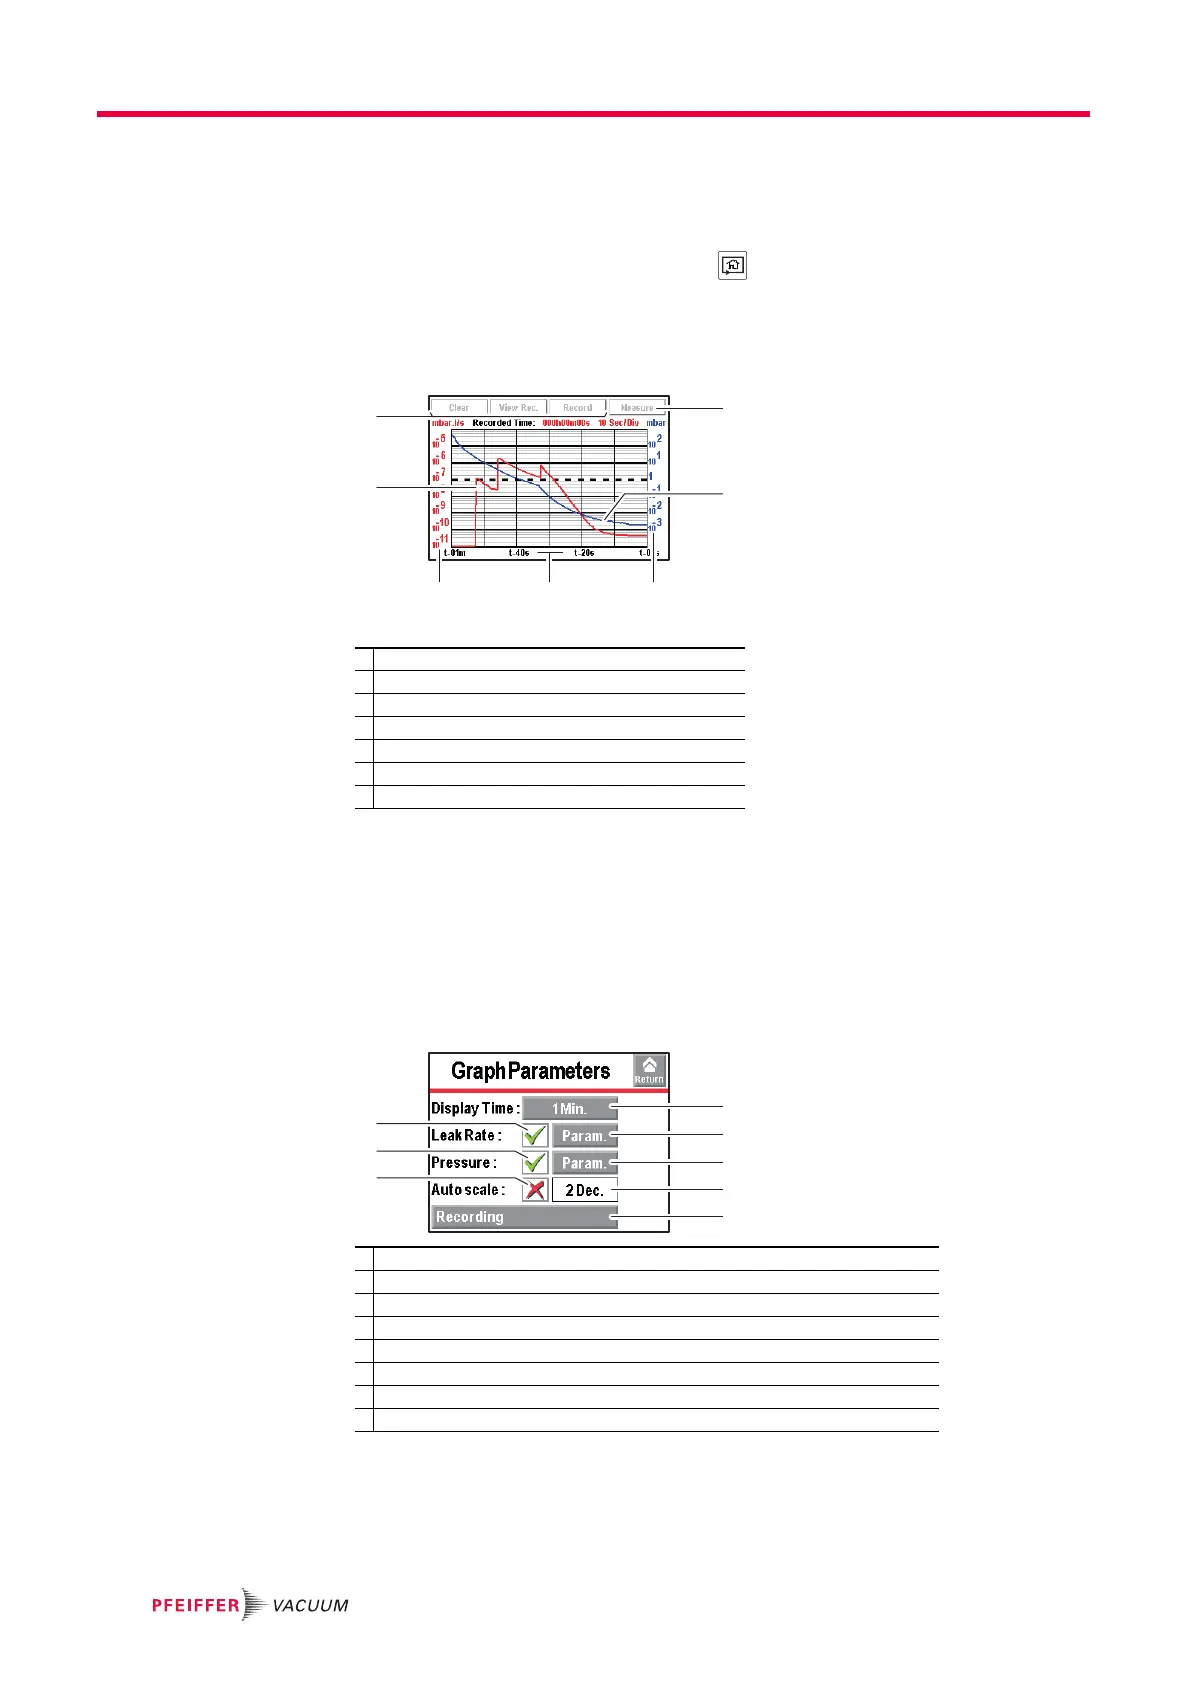
Fig. 10: "Graph" screen
Scales (3), (4), (5) are adjustable by pressing the graph.
The operator can move the "measurement" window on the touch screen.
Press the window and drag it to the chosen location.
7.1.2 Settings
Access the graph settings menu by pressing the graph.
Display
Automatic scale The automatic scale is used to display the measured leak rate centred on 2 or 4 decades.
The scale varies according to the leak rate measured. When the automatic scale is acti-
vated, the scales set for the leak rate and pressure (Pressure) are no longer taken into
account.
1 Deleting/Viewing/Recording a plot
2 Plot of the tracer gas leak rate (in red)
3 Scale of the tracer gas leak rate (in red)
4 Time scale
5 Inlet pressure scale (in blue)
6 Inlet pressure plot (in blue)
7 Displaying/Hiding the measurement (see 6.1.8)
1 Displaying/Hiding the measured leak rate
2 Displaying/Hiding the inlet pressure
3 Setting the recording time
4 Setting the inlet pressure scale
5 Setting the leak rate scale (If ’automatic’ scale is deactivated)
6 Screen scroll speed
7 Activating/Deactivating the automatic scale
8 Setting the automatic scale