L
L
L
L
L
t
t
t
t
t
A.
B.
C.
E.
D.
P_G_0074_SW
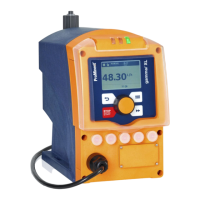
Fig. 7: Discharge stroke metering profiles with stroke L and time t (suction stroke shown as a dotted line)
It is possible to selectively also slow the suction stroke with all
these metering profiles for the discharge stroke - see . In this way,
it is possible to prevent the main cause of inaccurate metering with
high viscosity feed chemicals, namely the incomplete filling of the
liquid end. With gaseous feed chemicals, the slow suction stroke
prevents cavitation and consequently increases dosing precision.
normal
HV1
HV2 HV3
L
t
P_G_0075_SW
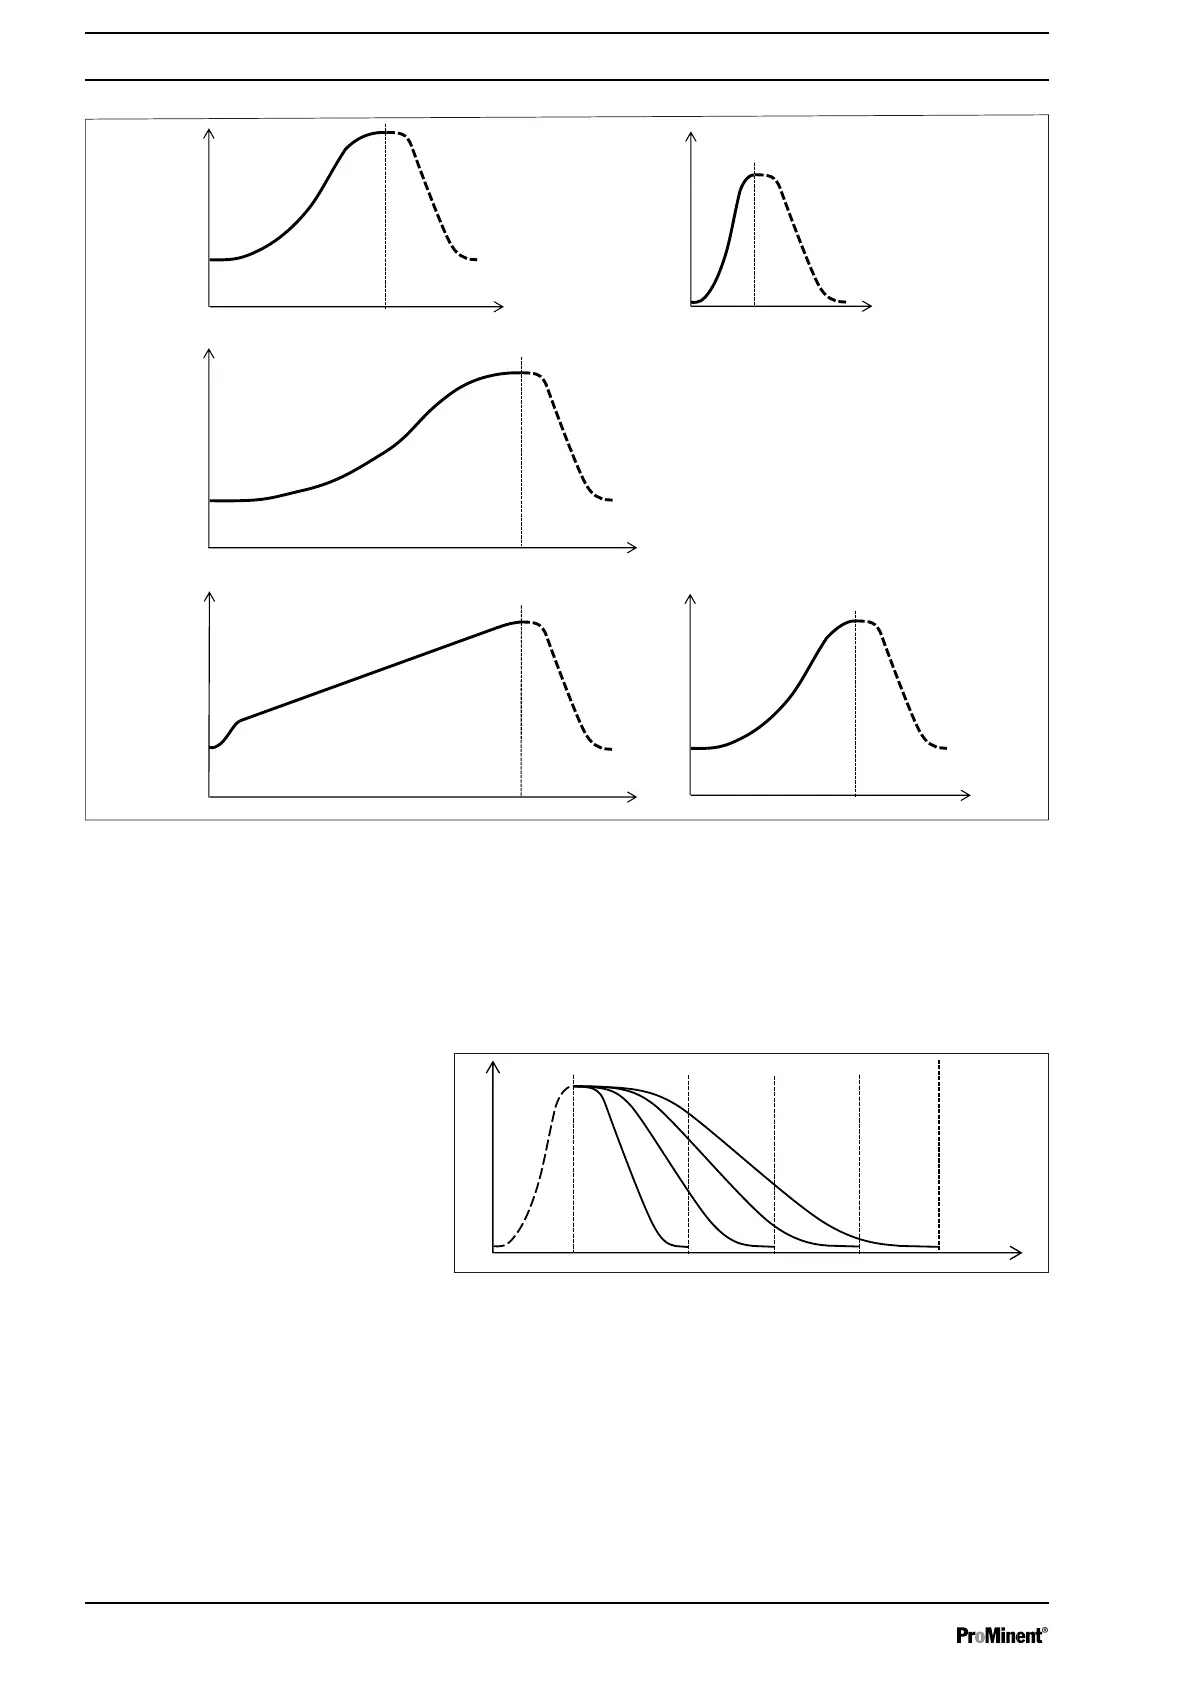
Fig. 8: Suction stroke metering profiles with stroke L and time t
Normal Normal suction stroke
HV1 Suction stroke for viscous feed chemical
HV2 Suction stroke for average viscosity feed chemical
HV3 Suction stroke for high-viscosity feed chemical
Back pressure oscillations in the dosing line, which could lead to
undesirable variations in the metering volume, are automatically
compensated for by the drive. This results in a dosing precision
that could otherwise only be achieved with complex control circuits.
Functional description
24
 Loading...