19
Chapter 2: Getting Started and Controlling the Chart Display
Controlling
the Chart
Tide Data
The symbol indicates tide height data is available for that position on the
chart. The Raychart displays a graph of real time predictions of the maximum
and minimum tide heights for the selected day. A digital readout provides
sunrise and sunset as well as tide details for the selected day. Time is displayed
in the selected local time zone.
Note: Tide predictions are accurate for moderate weather conditions. However
severe weather patterns can affect actual time and height.
➤ To obtain tide height data:
1. Place the cursor over the tide symbol
. The tide height object data box
and the soft keys EXPAND, ALL INFO and NEAREST are displayed.
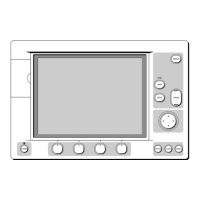
2. Press EXPAND. The data is displayed as illustrated below.
D4196_1
The time and draught are represented by a dotted vertical and horizontal line on
the graph. You can use the trackpad to move the lines; you move the vertical
line to select a time for which the tide height is displayed.
You can use the soft keys and trackpad to change the date for which tide
information is shown.
➤ To select a time, press the left or right side of the trackpad to move the cursor to
the required time.
➤ To change the day press PREV. DAY, TODAY or NEXT DAY as required.
Alternatively, press SET DATE; to change date, use the trackpad to move the
cursor left/right to select the digit and up/down to increase/decrease the digit.
The graph and tide data are updated.
Using
Chart Cards
 Loading...

