OPERATION
78
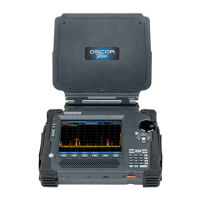
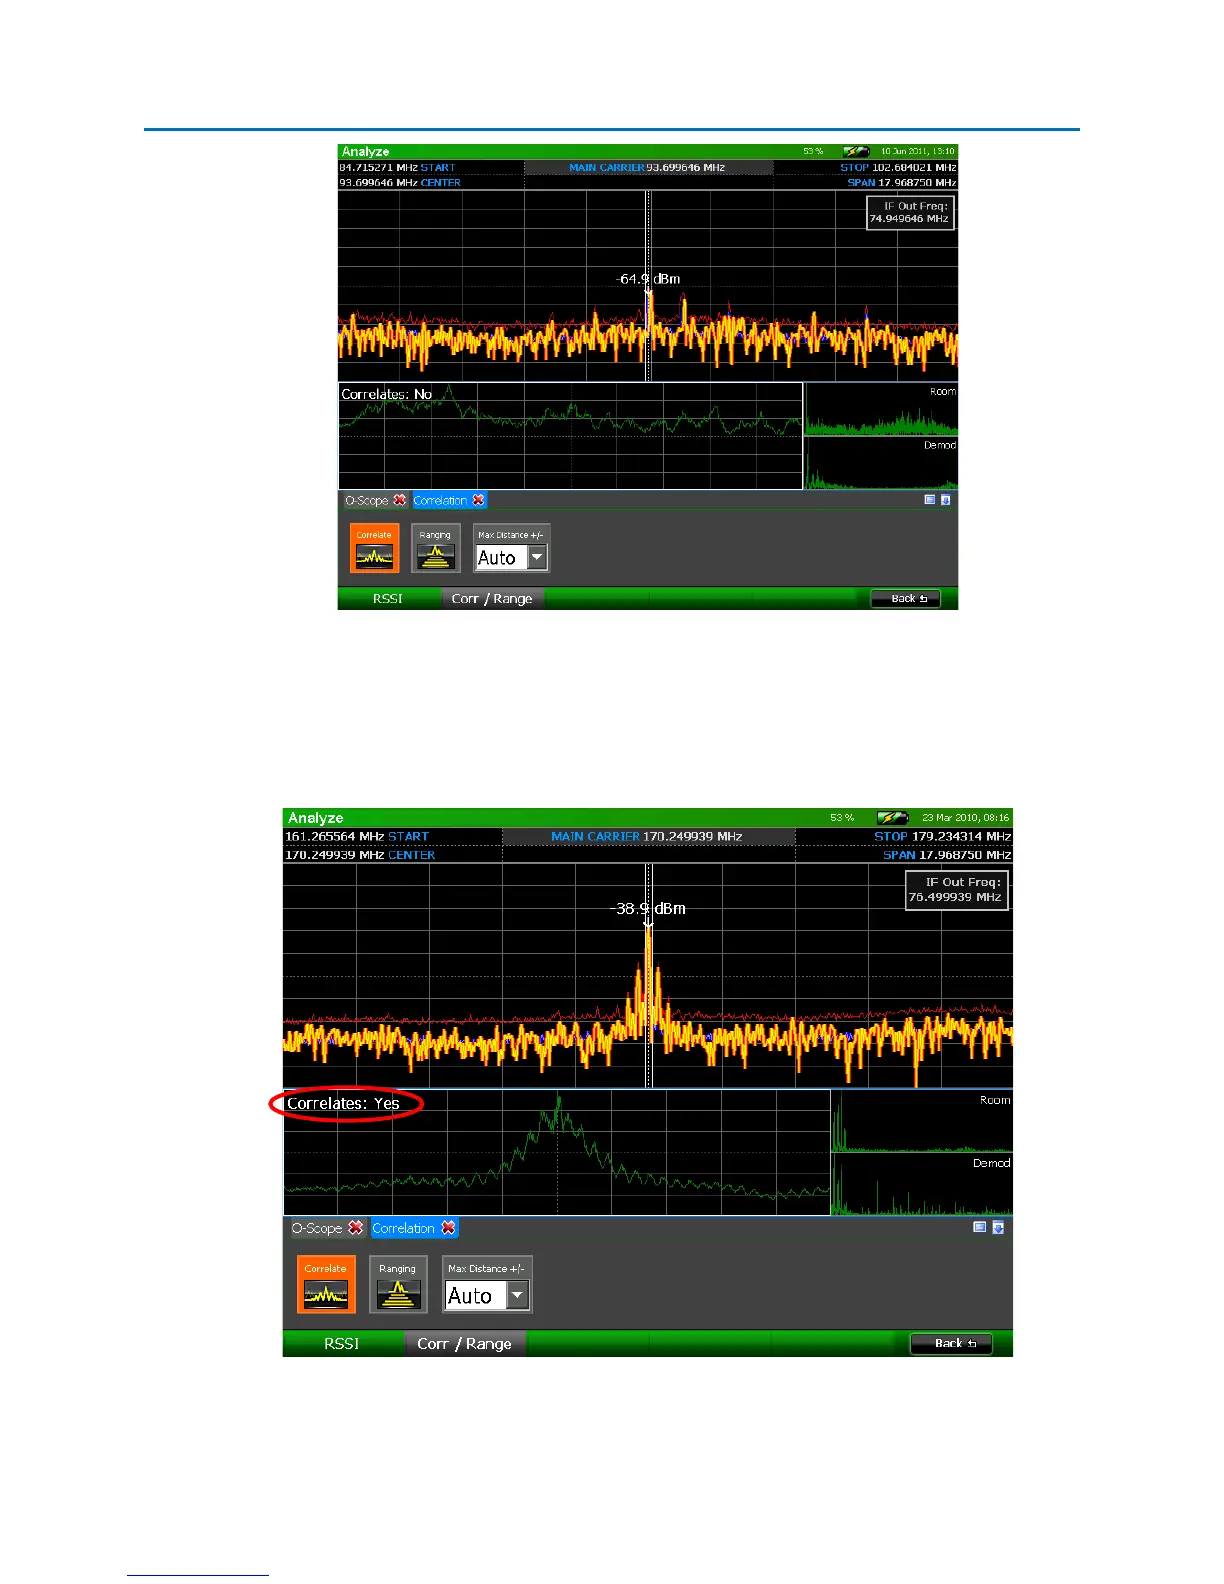
An increased level in the center of the graph is an indication that the demodulated signal correlates with
room audio and could be a potential threat. The OSCOR unit will automatically assess the correlation
graph and make a determination regarding whether or not the demodulated audio correlates with the
ambient room noise. The unit’s determination is displayed on the top left hand side of the correlation
graph.
To the right of the correlation graph, the OSCOR unit displays frequency domain graphs of the two audio
signals it is comparing to make its correlation determination. The graph labeled “Room” is the room
 Loading...