10 EB 5573-1 EN
Operation
2.2.1 Adapting the Trend-Viewer
The standard graph shows the data measured at the outdoor sensor AF1 and ow sensor
VF1 plotted over time.
¼ Open the Trend-Viewer.
Adding measuring data
q Select – – – – on the display.
¼ Activate editing mode for sensor selection.
q Select sensor.
¼ Conrm selected sensor.
Deleting measured data:
q Select the sensor whose measured data are no longer to
be displayed.
¼ Activate editing mode for sensor.
q Select – – – – on the display.
¼ Conrm deletion.
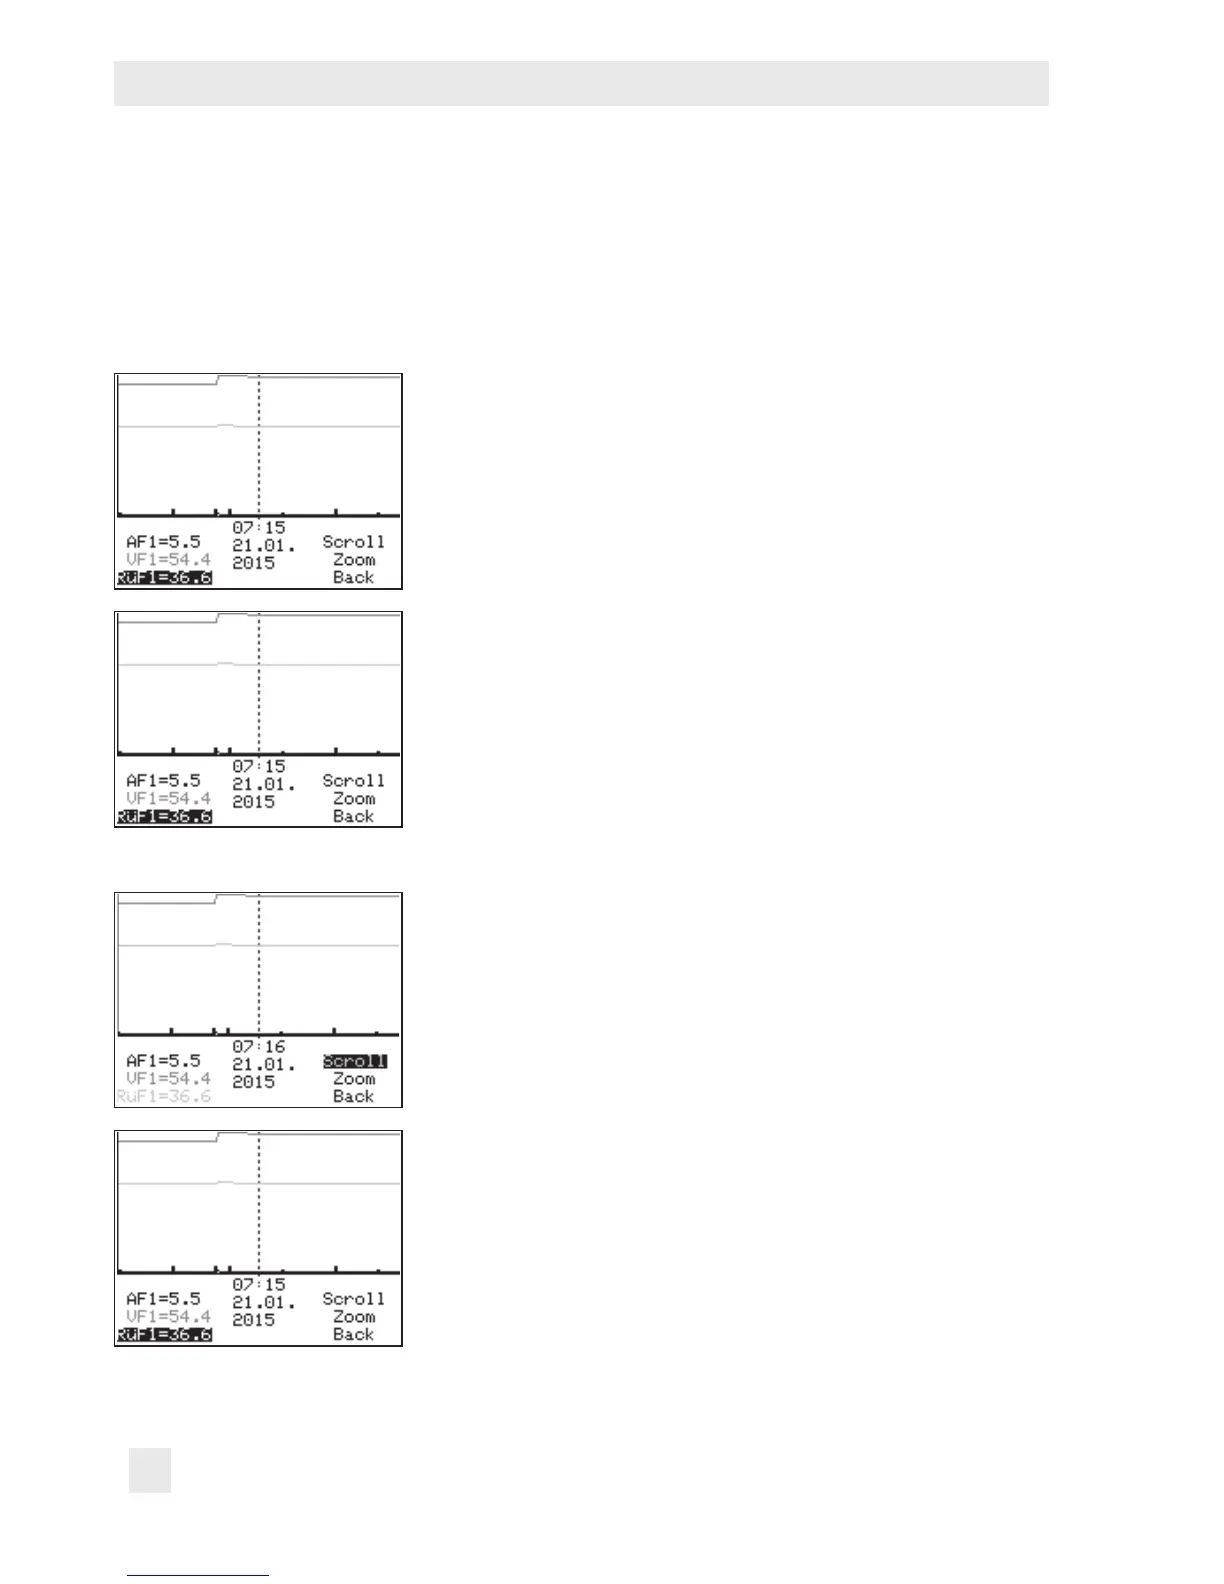
Shifting the time line:
q Select 'Scroll'.
¼ Activate editing mode for scroll function.
q Shift the time line.
¼ Conrm time display.