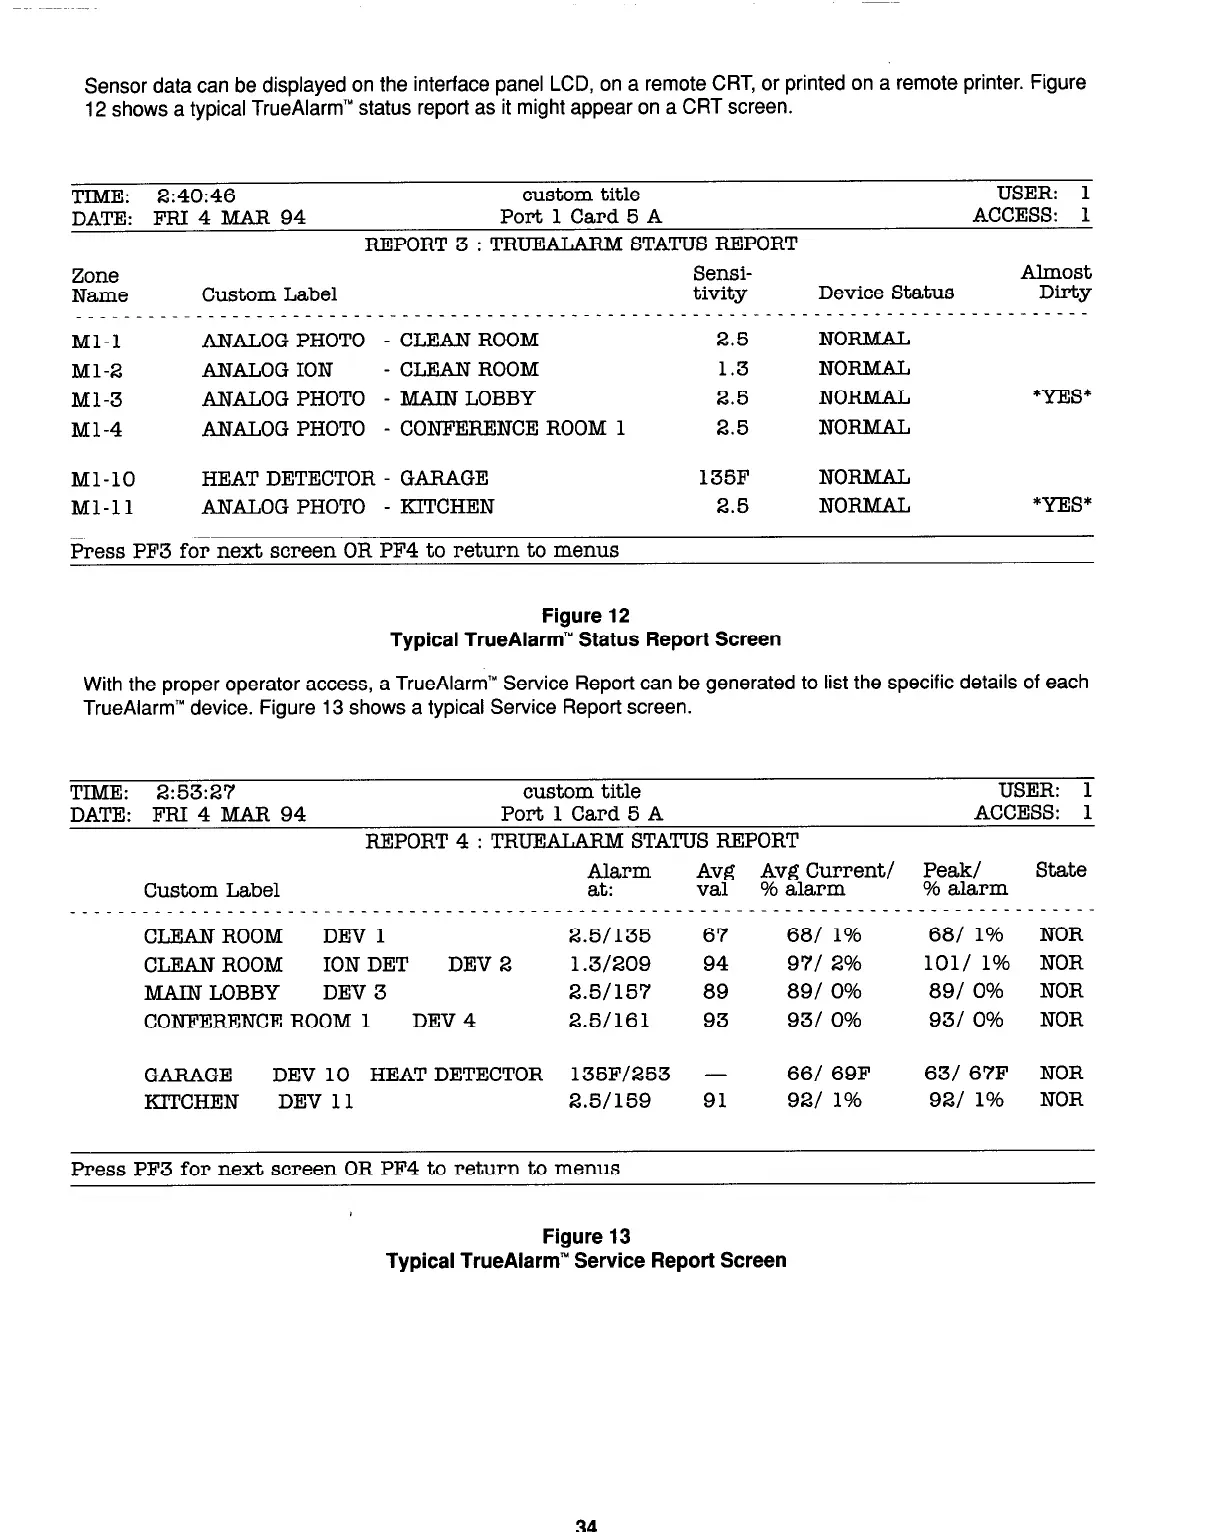
Sensor data can be displayed on the interface panel LCD, on a remote CRT, or printed on a remote printer. Figure
12 shows a typical TrueAlarm” status report as it might appear on a CRT screen.
TIME:
2:40:46
custom title
USER: 1
DATE: FRI 4 MAR
94
Port 1 Card 5 A
ACCESS: 1
REPORT 3 :
TRUEALARM STATUS REPORT
Zone
Sensi-
Almost
Name
Custom Label
tivity Device Status Dirty
_________-______________________________--------------------------------------------
Ml-l
ANALOG PHOTO - CLEAN ROOM
2.5
NORMAL
Ml-2
ANALOG ION - CLEAN ROOM
1.3
NORMAL
Ml-3
ANALOG PHOTO - MAIN LOBBY 2.5 NORMAL
*YES*
Ml-4
ANALOG PHOTO - CONFERENCE ROOM 1
2.5 NORMAL
Ml-10
HEAT DETECTOR - GARAGE
Ml-l 1
ANALOG PHOTO - KITCHEN
Press PF3 for next screen OR PF4 to return to menus
135F
NORMAL
2.5 NORMAL
*YES*
Figure 12
Typical TrueAlarm” Status Report Screen
With the proper operator access, a TrueAlarm” Service Report can be generated to list the specific details of each
TrueAlarm” device. Figure 13 shows a typical Service Report screen.
TIME: 2:53:27
custom title
USER: 1
DATE: FRI 4 MAR 94
Port 1 Card 5 A
ACCESS: 1
REPORT 4 :
TRUEALARM STATUS R.EPORT
Alarm
Avg Avg Current/ Peak/ State
Custom Label
at: val
% alarm
% alarm
____---_-_______________________________--------------------------------
CLEAN ROOM DEV 1
2.51135 67 68l
1% 681
1% NOR
CLEAN ROOM ION DET DEV 2 1.3/209 94 97l 2%
lOl/ 1%
NOR
MAIN LOBBY DEV 3
2.5/157 89 891
0% 891
0% NOR
CONFERENCE ROOM 1 DEV 4
2.5/161 93 931
0% 93l
0% NOR
GARAGE
DEV 10 HEAT DETECTOR
135F/253 -
66/ 69F 631
67F NOR
KITCHEN
DEV 11
2.5/159 91
921 1% 92l
1% NOR
Press PF3 for next screen OR PF4 to return to menus
Figure 13
Typical TrueAlarm” Service Report Screen
34
Technical Manuals Online! - http://www.tech-man.com