40
Operations Viewing Data Graphically
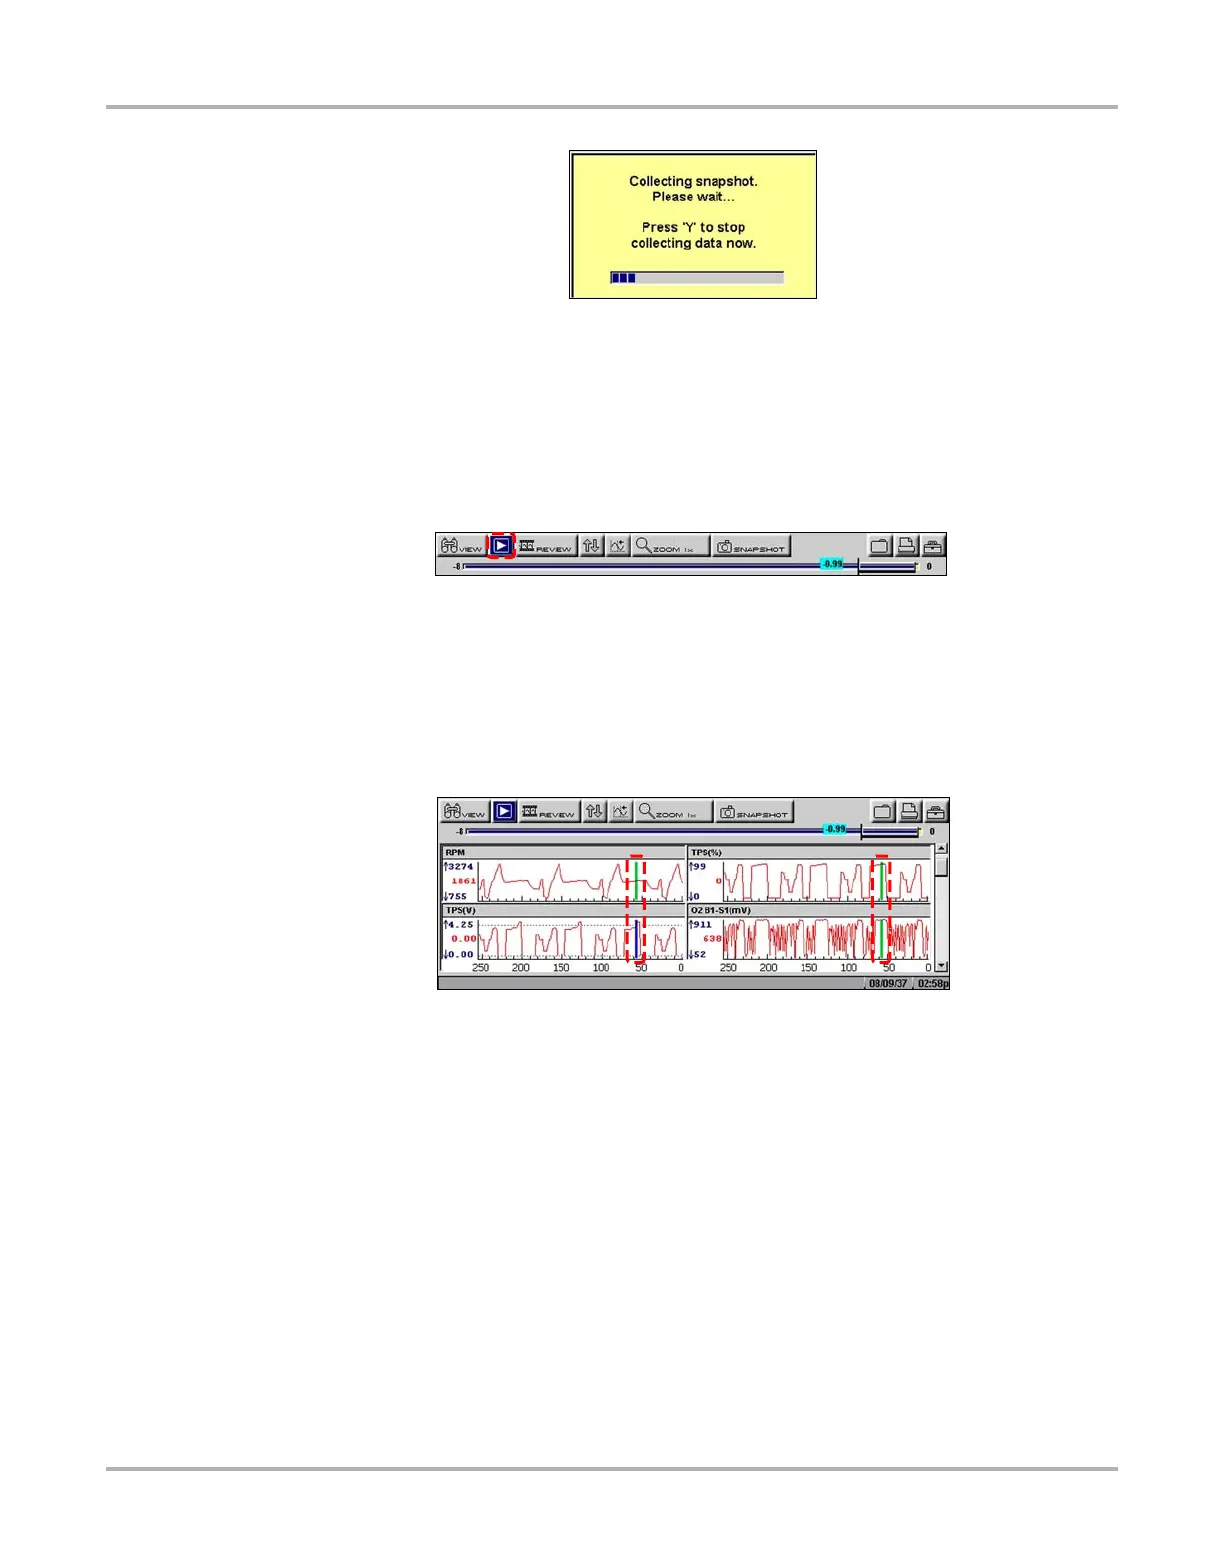
Figure 5-28 Sample collecting snapshot dialog box
The amount of data collected is specified by the % After Trigger setting, found in Utilities > Tool
Setup > Save Data. You can manually stop the snapshot by pressing Y/a at any time during the
data collection.
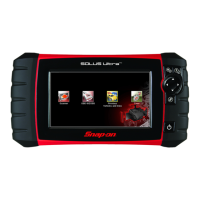
Once data collection is finished, graphing on-screen stops and the Pause button automatically
changes to the Play button (Figure 5-29).
Figure 5-29
Sample paused upper toolbar—Play button
Once data collection is finished, graphing on-screen stops and the Pause button automatically
changes to the Play button. A vertical line now appears on each of the data graphs to indicate the
triggering point. The trigger line on the parameter that triggered the snapshot is a different color
than those on the other graphs (Figure 5-30). This makes it easy to determine which parameter
caused the trigger.
Figure 5-30
Sample trigger detection line
z To restart graphing:
• Select the Play button (Figure 5-29).
z To clear trigger levels:
1. Select a parameter.
The parameter menu displays.
2. Select a Clear option.
– Clear Trigger Levels—removes the trigger settings from the selected parameter only.
– Clear All Trigger Levels—removes the trigger settings from all of the parameters with
trigger settings.
z To disarm PID Triggering:
• Select SNAPSHOT > PID Trigger.