39
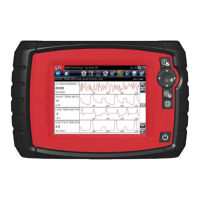
Operations Viewing Data Graphically
4. Press Y/a to set the trigger.
When set, the solid black line changes to a dotted line and the position value no longer
displays (Figure 5-26).
1— Upper trigger level
2— Lower trigger level
Figure 5-26
Sample set trigger levels
5. Adjust the lower trigger level using the up b and down d arrows and press Y/a to set it.
The area between the two trigger levels establishes the triggering condition. Any data points
that register outside of your set condition trigger the on-screen graphing to pause.
6. Press Y/a if you want to switch between trigger level lines during the setting process.
7. When you finish setting your trigger level, press N/X.
NOTE:
i Only three PIDs can have trigger levels set at one time, but only one of the conditions needs to be
satisfied for triggering to occur.
z To arm PID Triggering:
1. From the upper toolbar, select Snapshot > PID Trigger.
2. Select from the drop-down menu (Figure 5-27):
– PID Trigger—begins collecting when a signal outside the set conditions occurs
– Manual—begins collecting the next time the SNAPSHOT button is selected
Figure 5-27
Sample armed triggering
A check mark displays next to the selected menu option.
Trigger Delay
Once the trigger is detected, a collecting snapshot dialog box displays (Figure 5-28) and data after
the trigger detection begins to collect.
1
2