38
Operations Viewing Data Graphically
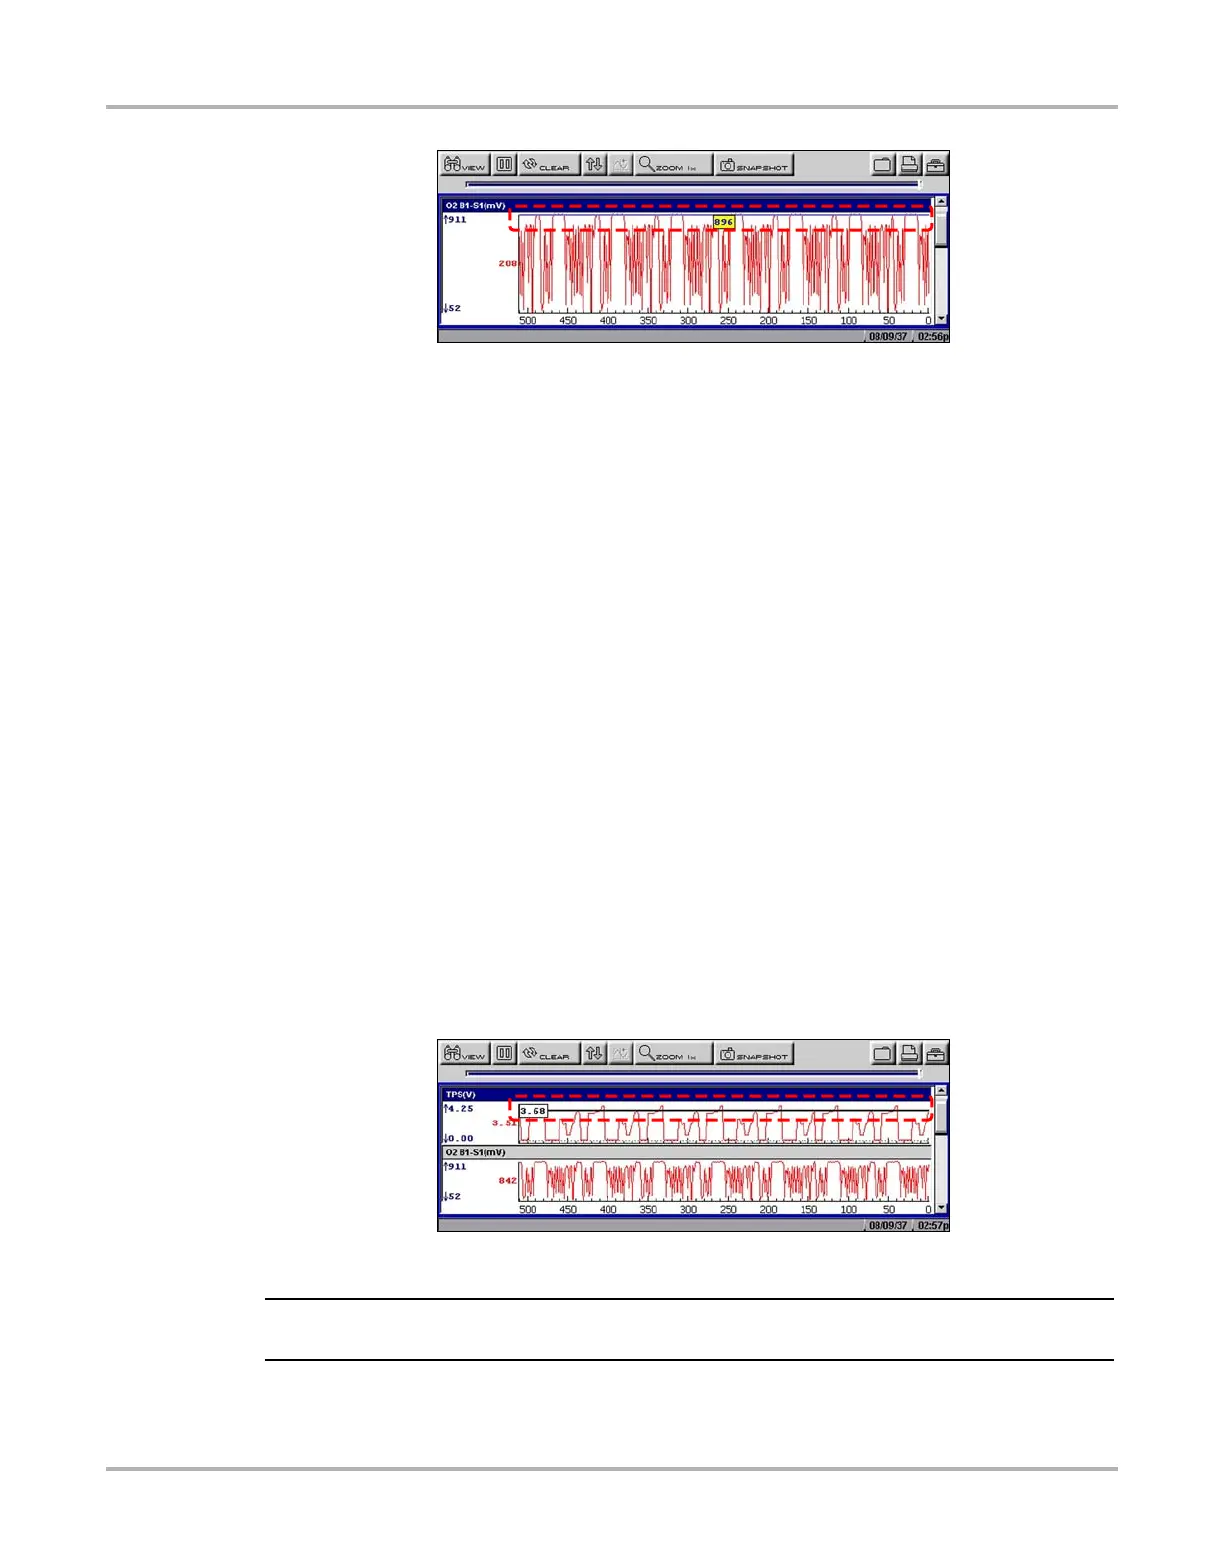
Figure 5-24 Sample manually scaling a parameter
3. Use the down d arrow to move the maximum displayed value into position.
4. Press Y/a to set the selected value.
5. Press Y/a to scale the minimum value.
6. Use the up b arrow to move the maximum displayed value into position.
7. Press Y/a to set the selected value.
8. Press N/X to exit manual scale.
The top and bottom of the graph is now clipped so that only the portion that falls between the
selected minimum and maximum values displays.
z To scale all parameters:
1. Select a parameter.
The parameter menu displays.
2. Select Scale All.
The minimum and maximum graph values are reset for all of the parameters.
z To set trigger levels:
1. Select a parameter.
The parameter menu displays.
2. Select Set Trigger Levels.
The active trigger level line displays as a solid black line together with an on-screen position
value (Figure 5-25).
Figure 5-25
Sample active trigger line
NOTE:
i Both an upper and lower trigger level must be set.
3. Adjust the upper trigger level using the up b and down d arrows to place the trigger level line
where you want it on the PID graph.