From this access, the measurements recorded are shown in graphical mode.
For each measurement, NET VISION stores the minimum, average and maximum values during
the sample rate (60 minutes by default)
By default, the NET VISION shows the last 30 minutes records. It could be that the NET VISION
shows “No Record!” due to the sample rate; in such a case, another period must be chosen to
have data in the table.
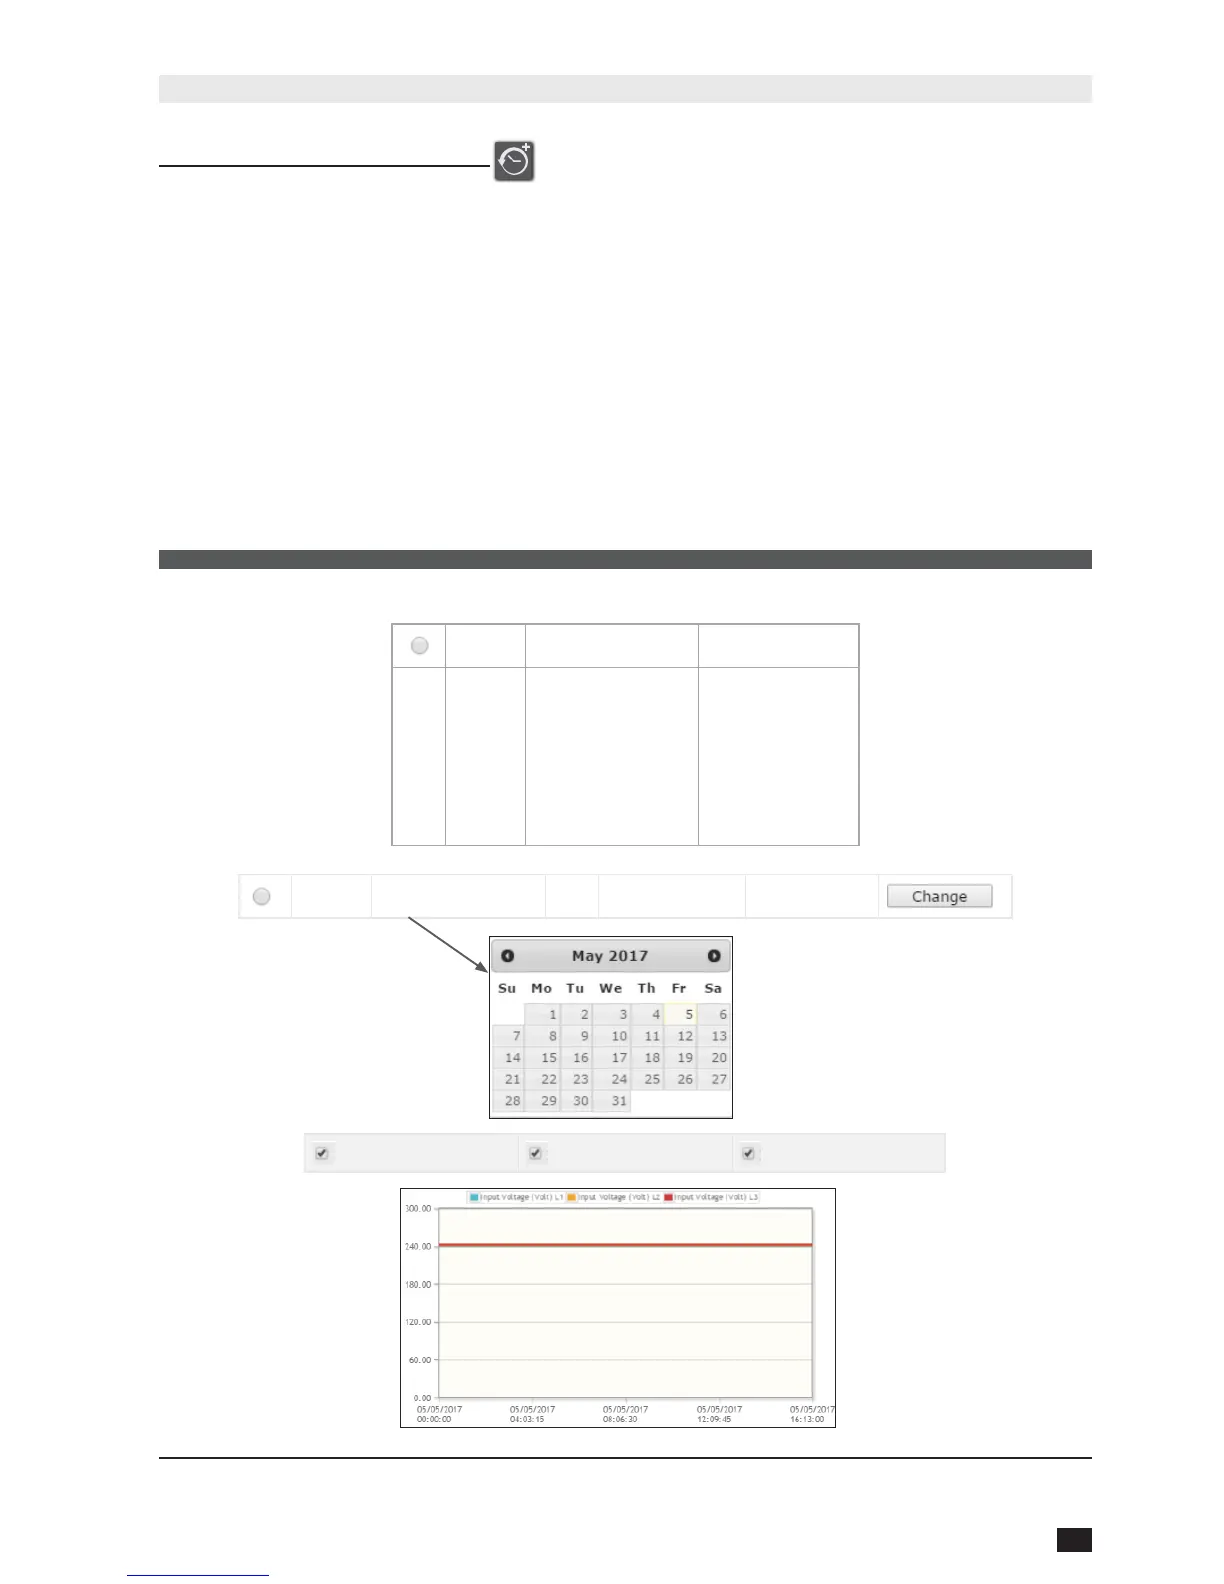
The time window can be selected by Specic Period or by Day Selection using the calendar function.
Measurements group selection: (all groups are selected by default)
Input Information: includes input voltage per phase and input frequency
Output information: includes output voltage per phase, global output load
UPS information: includes UPS temperature and battery capacity
UPS Extended History Graphic
Show
Specic Period
Records
30 minutes
60 minutes
3 hours
6 hours
12 hours
1 day
Show dd/mm/yyyy to dd/mm/yyyy Records
Input information Output information UPS information
The graphs represent the minimum, average and maximum values of each measurement.