10-17Lasair® Pro Aerosol Particle Counter Operations Manual
Chapter 10 : Display, Data and Reports
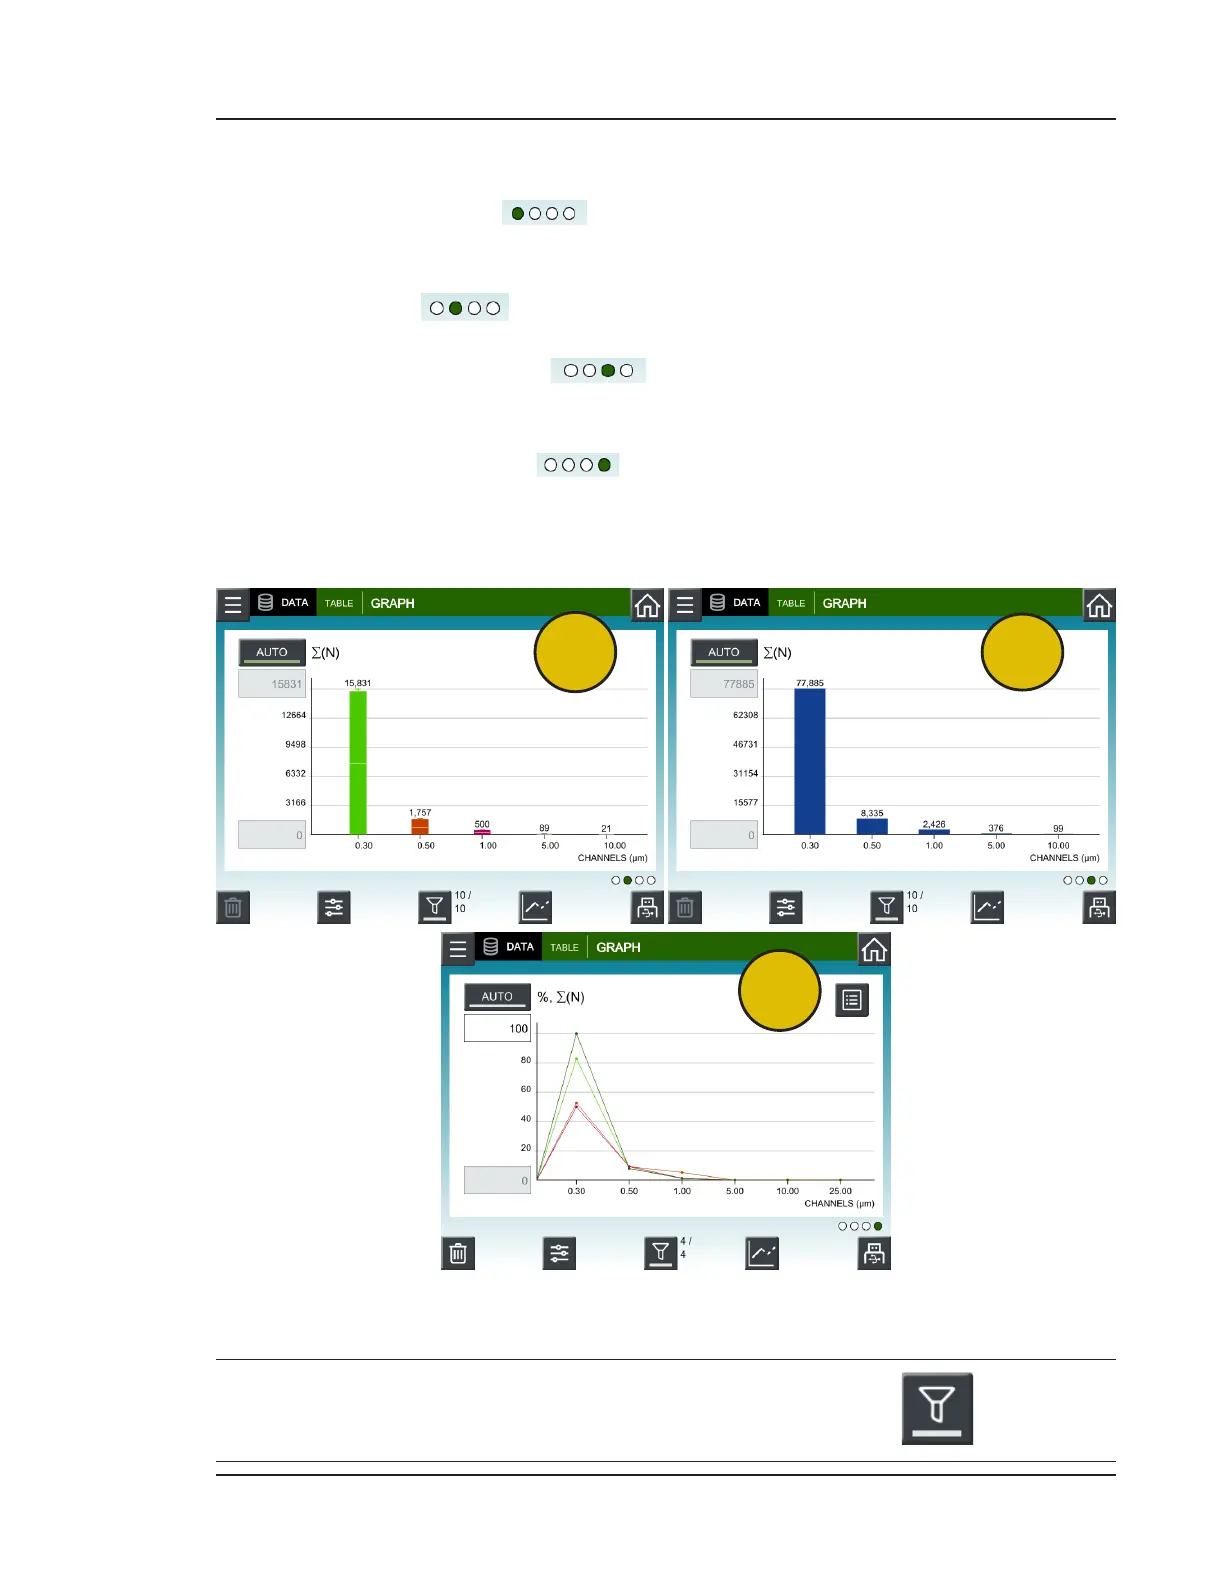
The GRAPH tab is for viewing four possible graphical displays:
• A. Historical Trend ( ): Particle counts over time for all configured
channel sizes. Multi-colored lines represent individual channels. Used for trending
data over multiple samples. Time format is DD/HH:MM.
• B. Box Plot ( ): Multi-colored box and whisker plot displays particle
counts for all configured channel sizes.
• C. Historical Histogram ( ): Bar graph displays particle counts for all
configured channel sizes. Raw data: Displays the sum of particle channel data.
Normalized data: Displays the average of the samples.
• D. Frequency Polygon ( ): Displays line graph of particle counts from
eight samples for all configured channel sizes. Multi-colored lines represent
individual samples.
D
B
C
Figure 10-8. Additional formats on the GRAPH tab, DATA
NOTE: The TABLE and GRAPH tabs support data filtering. Press to filter the
display to show specific ranges of data.


 To Next Page