Chapter 10 : Display, Data and Reports
10-6 Lasair® Pro Aerosol Particle Counter Operations Manual
Image Name Description
Auto scale
This option allows all sampling data
to be displayed on the graph. The
maximum value for the y-axis scale
adjusts automatically.
Min
The minimum value to display for the
y-axis. This field is only active when
the Auto Scale option is O.
Max
The maximum value to display for
the y-axis. This field is only active
when the Auto Scale option is O.
Table 10-2. TREND tab, DISPLAY
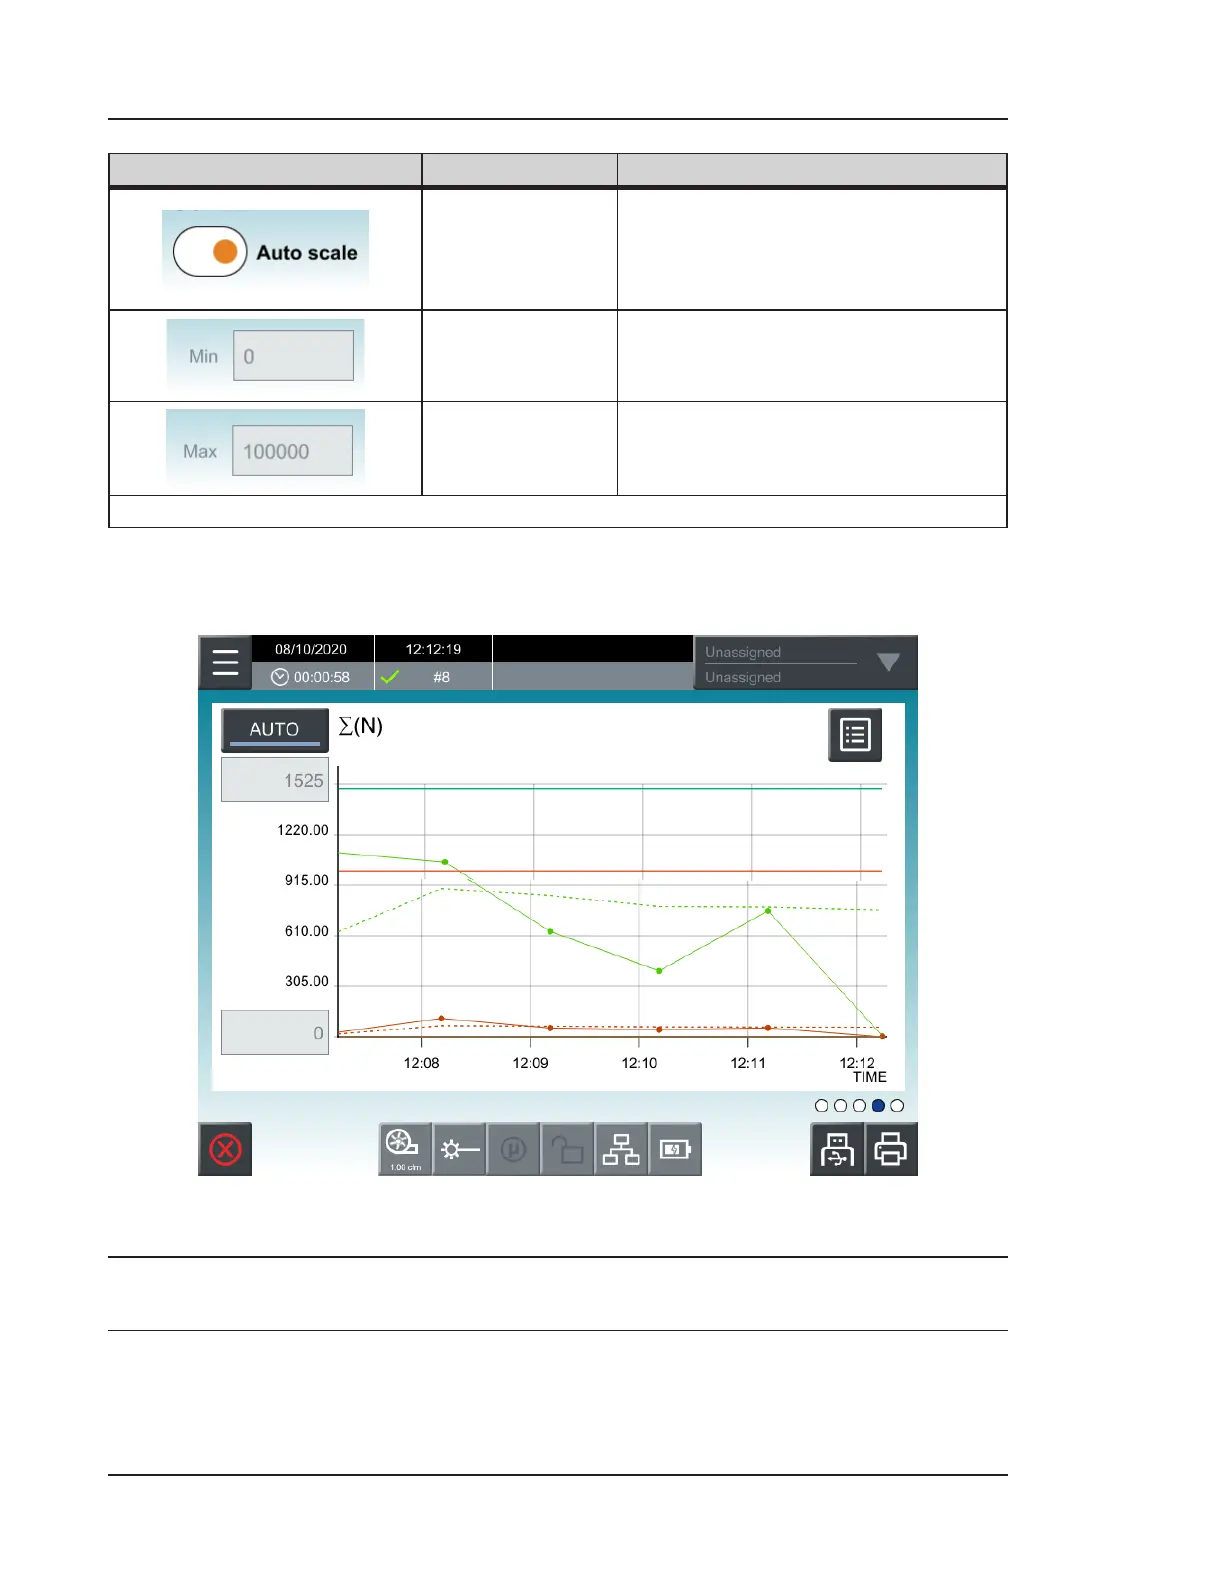
Example Trend Graph
Figure 10-3. Example trend graph, MAIN screen
NOTE: Each datapoint represents one sample.


 To Next Page