104
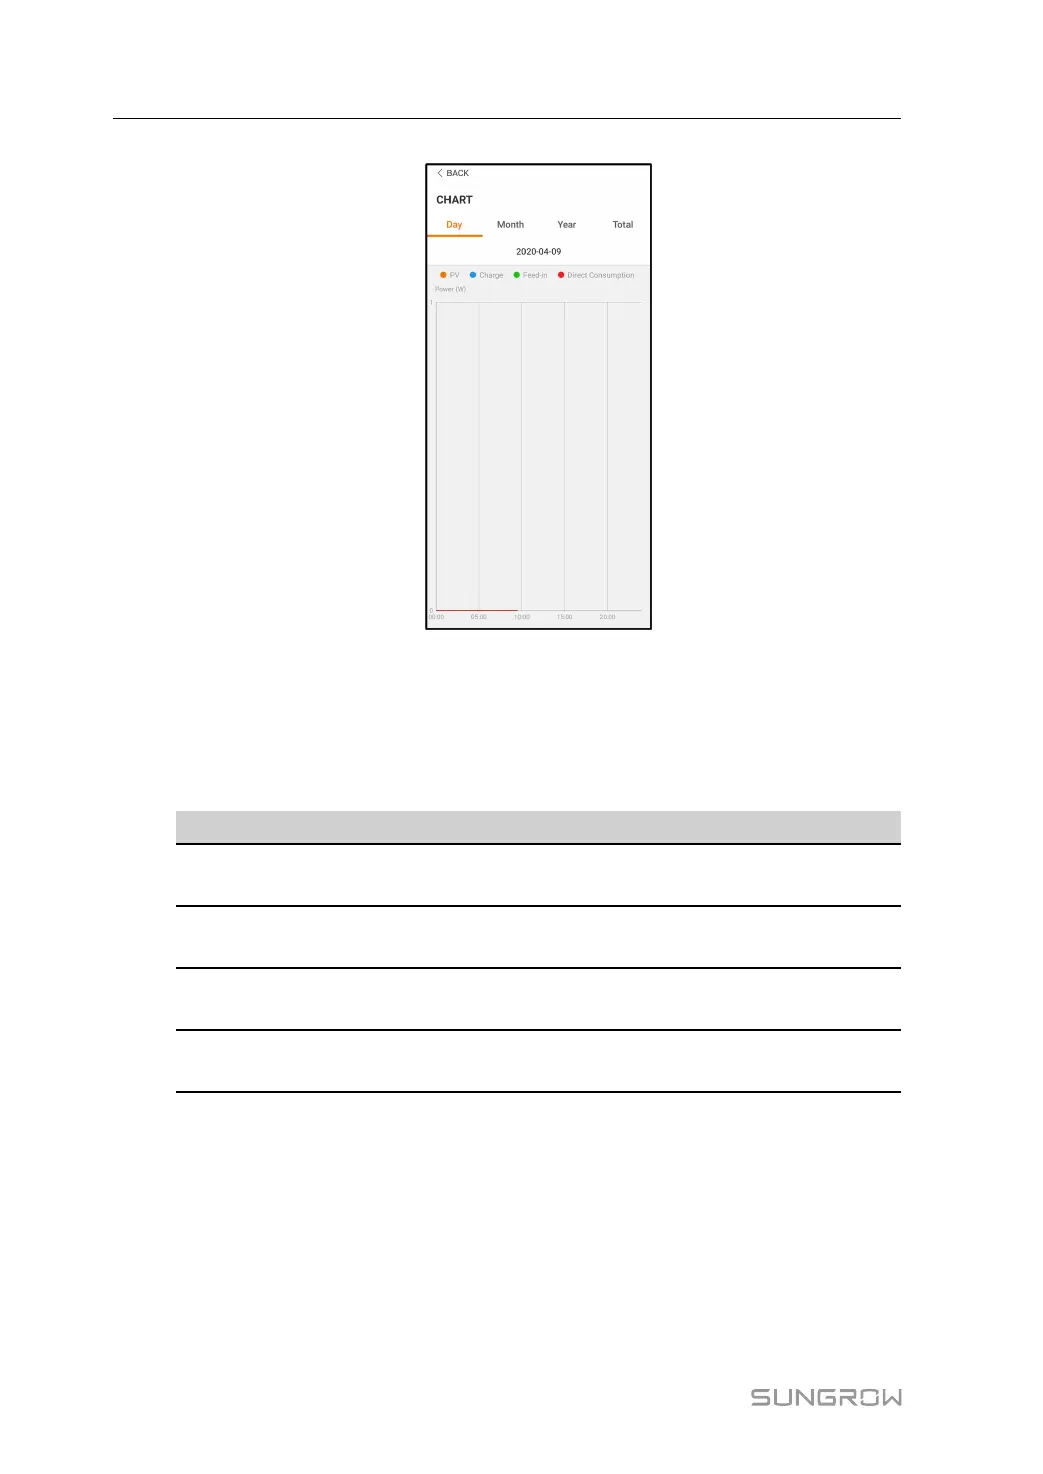
figure 8-12 Power Curve
The App displays power generation records in a variety of forms, including daily power gen-
eration graph, monthly power generation histogram, annual power generation histogram,
and total power generation histogram.
table 8-6 Description of power generation records
Item Description
Daily power generation
graph
Indicates today power generation, charging, feed-in power,
and direct consumption power
Monthly power generation
histogram
Indicates monthly power generation, charging, feed-in
power, and direct consumption power
Annual power generation
histogram
Indicates annual power generation, charging, feed-in power,
and direct consumption power
Total power generation
histogram
Indicates total power generation, charging, feed-in power,
and direct consumption power
8.9.2 Fault Alarm Record
Tap Fault Alarm Record to enter the screen, as shown in the following figure.
8 iSolarCloud App User Manual