102
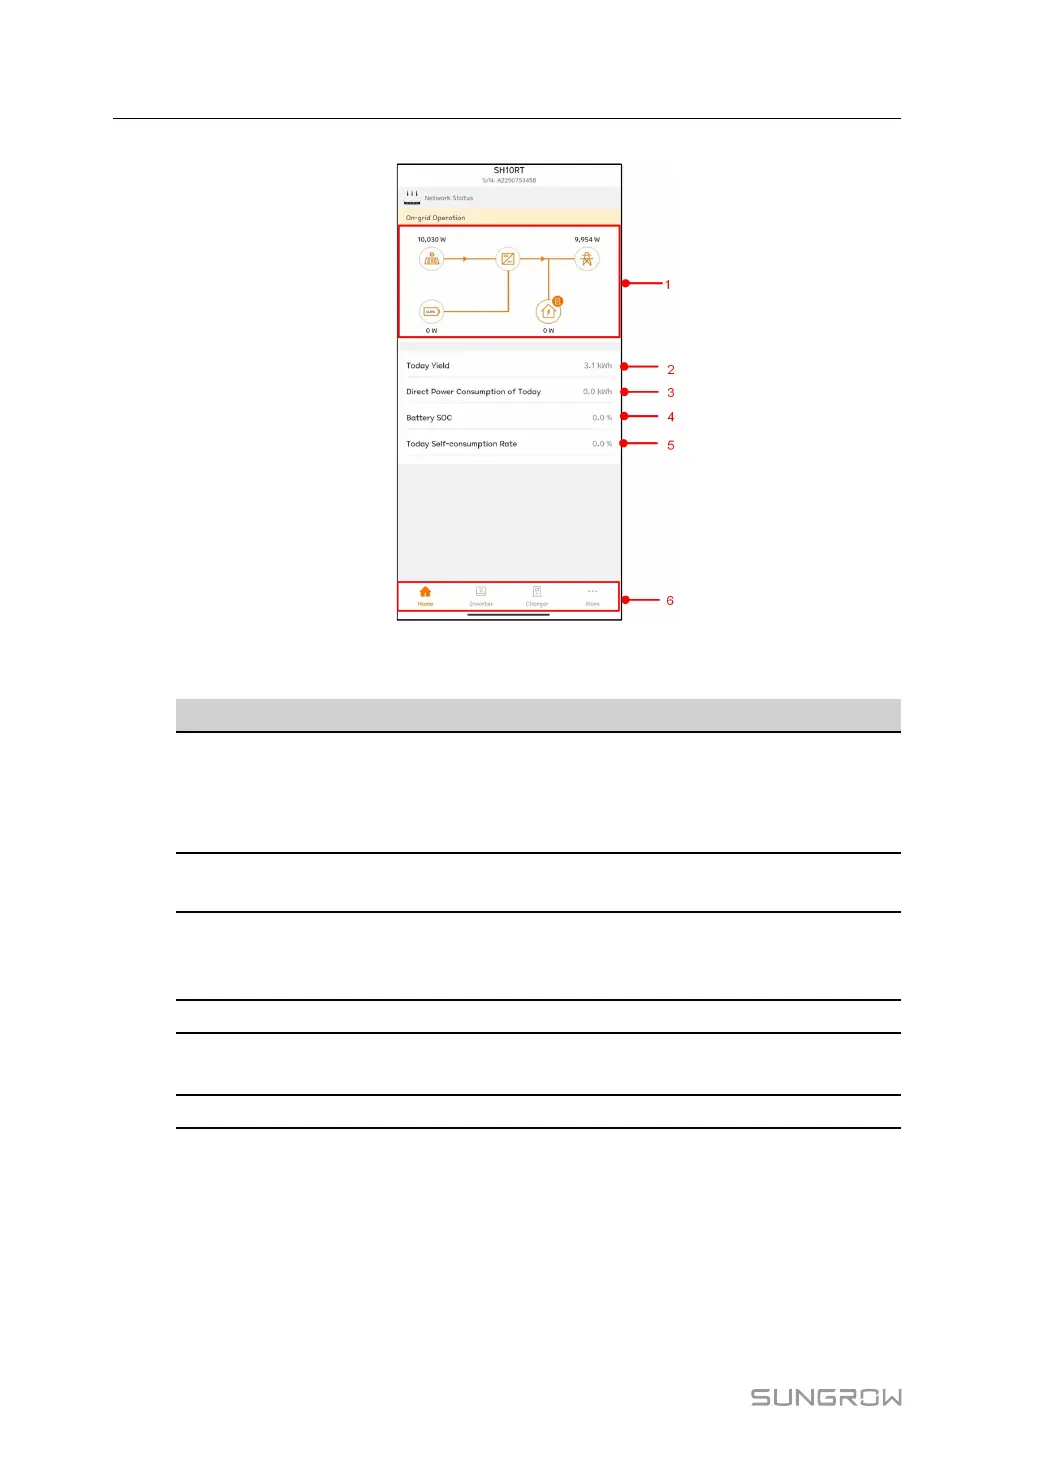
figure 8-9 EV charger Home Page
table 8-5 Home page description
No. Name
Description
1 Load flow chart
Shows the PV power generation power, feed-in
power, etc. The line with an arrow indicates energy
flow between connected devices, and the arrow
pointing indicates energy flow direction
2
Today yield
Shows the energy generated by the inverter today
in kWh
3
Direct power con-
sumption of today
Shows the part of the PV generated energy that
was directly consumed by the house loads today in
kWh
4
Battery SOC
Indicates remaining battery capacity
5
Today self-consump-
tion rate
Indicates the self consumption rate of the PV sys-
tem today
6
Navigation bar Includes Home,Inverter,Charger,More
8.8 Run Information
Tap Run Information on the navigation bar to enter the corresponding screen, as shown in
the following figure.
8 iSolarCloud App User Manual