85
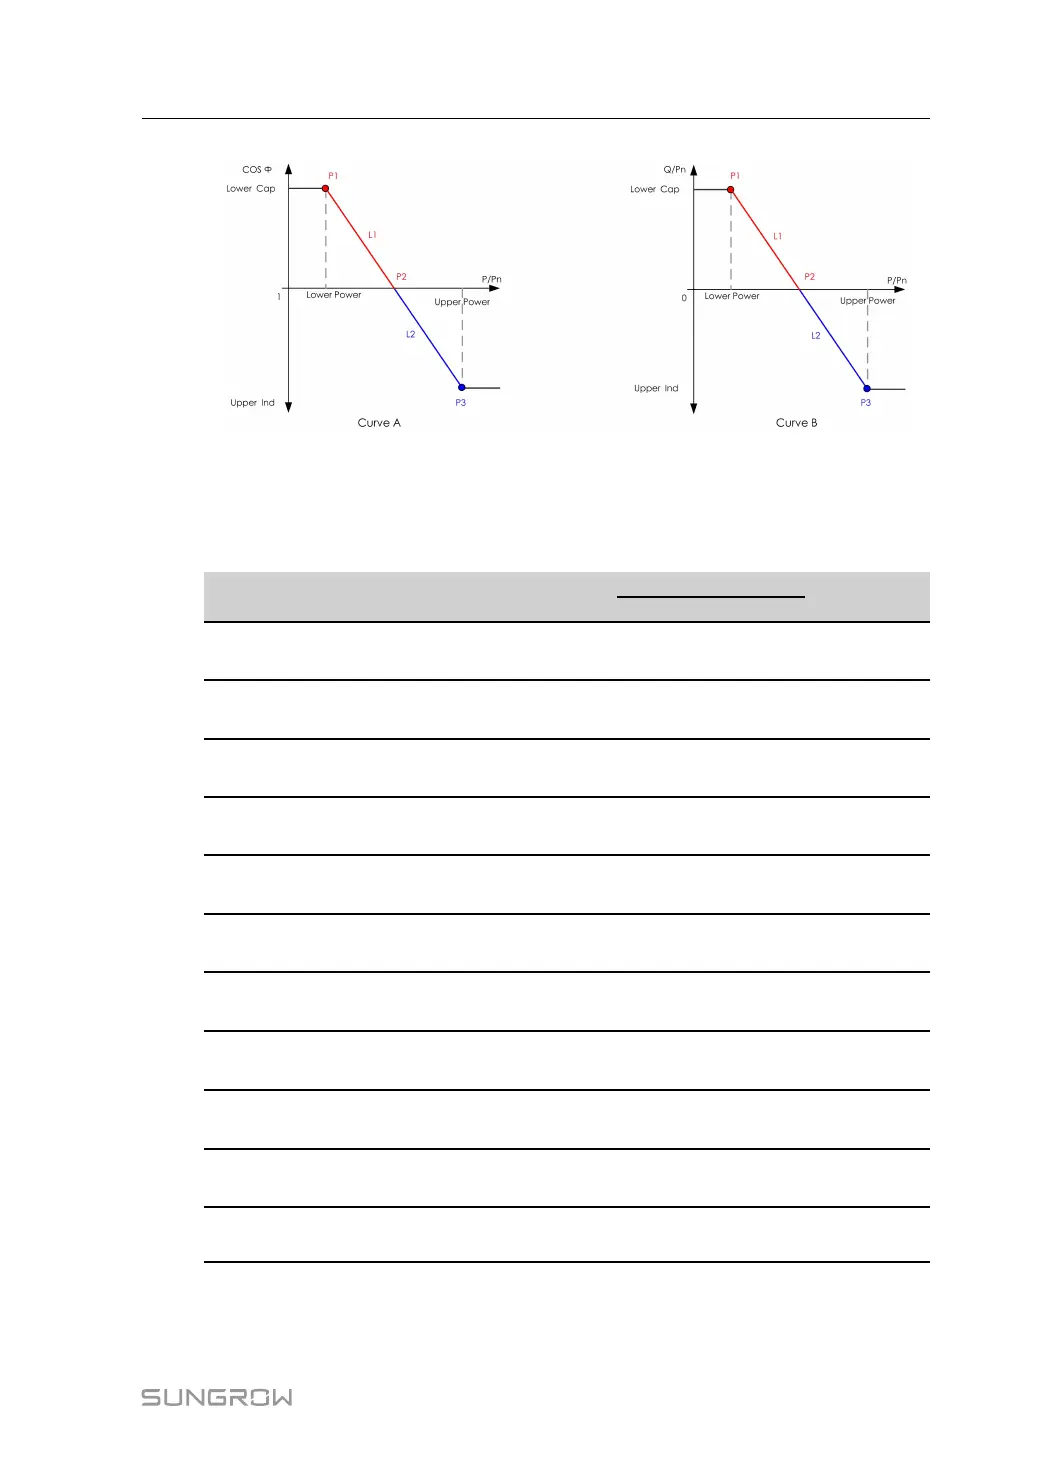
figure 8-4 Q(P) Curve
“Q(U)” Mode
The reactive power output of the inverter will vary in response to the grid voltage.
table 8-4 “Q(U)” Mode Parameter Descriptions:
Parameter
Explanation
Default
Range
DE AU
Q(U) curve
Select corresponding curve ac-
cording to local regulations
A
A, B, C
*
Hysteresis
Ratio
Voltage hysteresis ratio on the
Q(U) mode curve
0 0 ~ 5%
QU_V1
Grid voltage limit at P1 on the
Q(U) mode curve
93% 90% 80% ~ 100%
QU_Q1
Value of Q/Sn at P1 on the Q
(U) mode curve
-60% -30% -60% ~ 0
QU_V2
Grid voltage limit at P2 on the
Q(U) mode curve
97% 95.6% 80% ~ 110%
QU_Q2
Value of Q/Sn at P2 on the Q
(U) mode curve
0 -60% ~ 60%
QU_V3
Grid voltage limit at P3 on the
Q(U) mode curve
103%
AU: 108.7%
NZ: 108.6%
100% ~
120%
QU_Q3
Value of Q/Sn at P3 on the Q
(U) mode curve
0 -60% ~ 60%
QU_V4
Grid voltage limit at P4 on the
Q(U) mode curve
107%
AU: 115.2%
NZ: 110.8%
100% ~
120%
QU_Q4
Value of Q/Sn at P4 on the Q
(U) mode curve
60% 30% 0 ~ 60%
QU_
EnterPower
Active power for Q(U) function
activation
80% 20% ~ 100%
User Manual 8 iSolarCloud App