9. Sub window
9.1. Bar Display
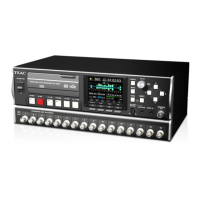
If you click on the Bar Display in the tool bar, a bar graph will appear.
A bar graph can display up to 16 channels (equivalent to an expansion unit). For the 32-channel
and 64-channel models, 2 bar graphs and 4 bar graphs will be displayed respectively.
9.1.1. Peak-hold reset button
Reset peaks indicated with white lines for each channel.
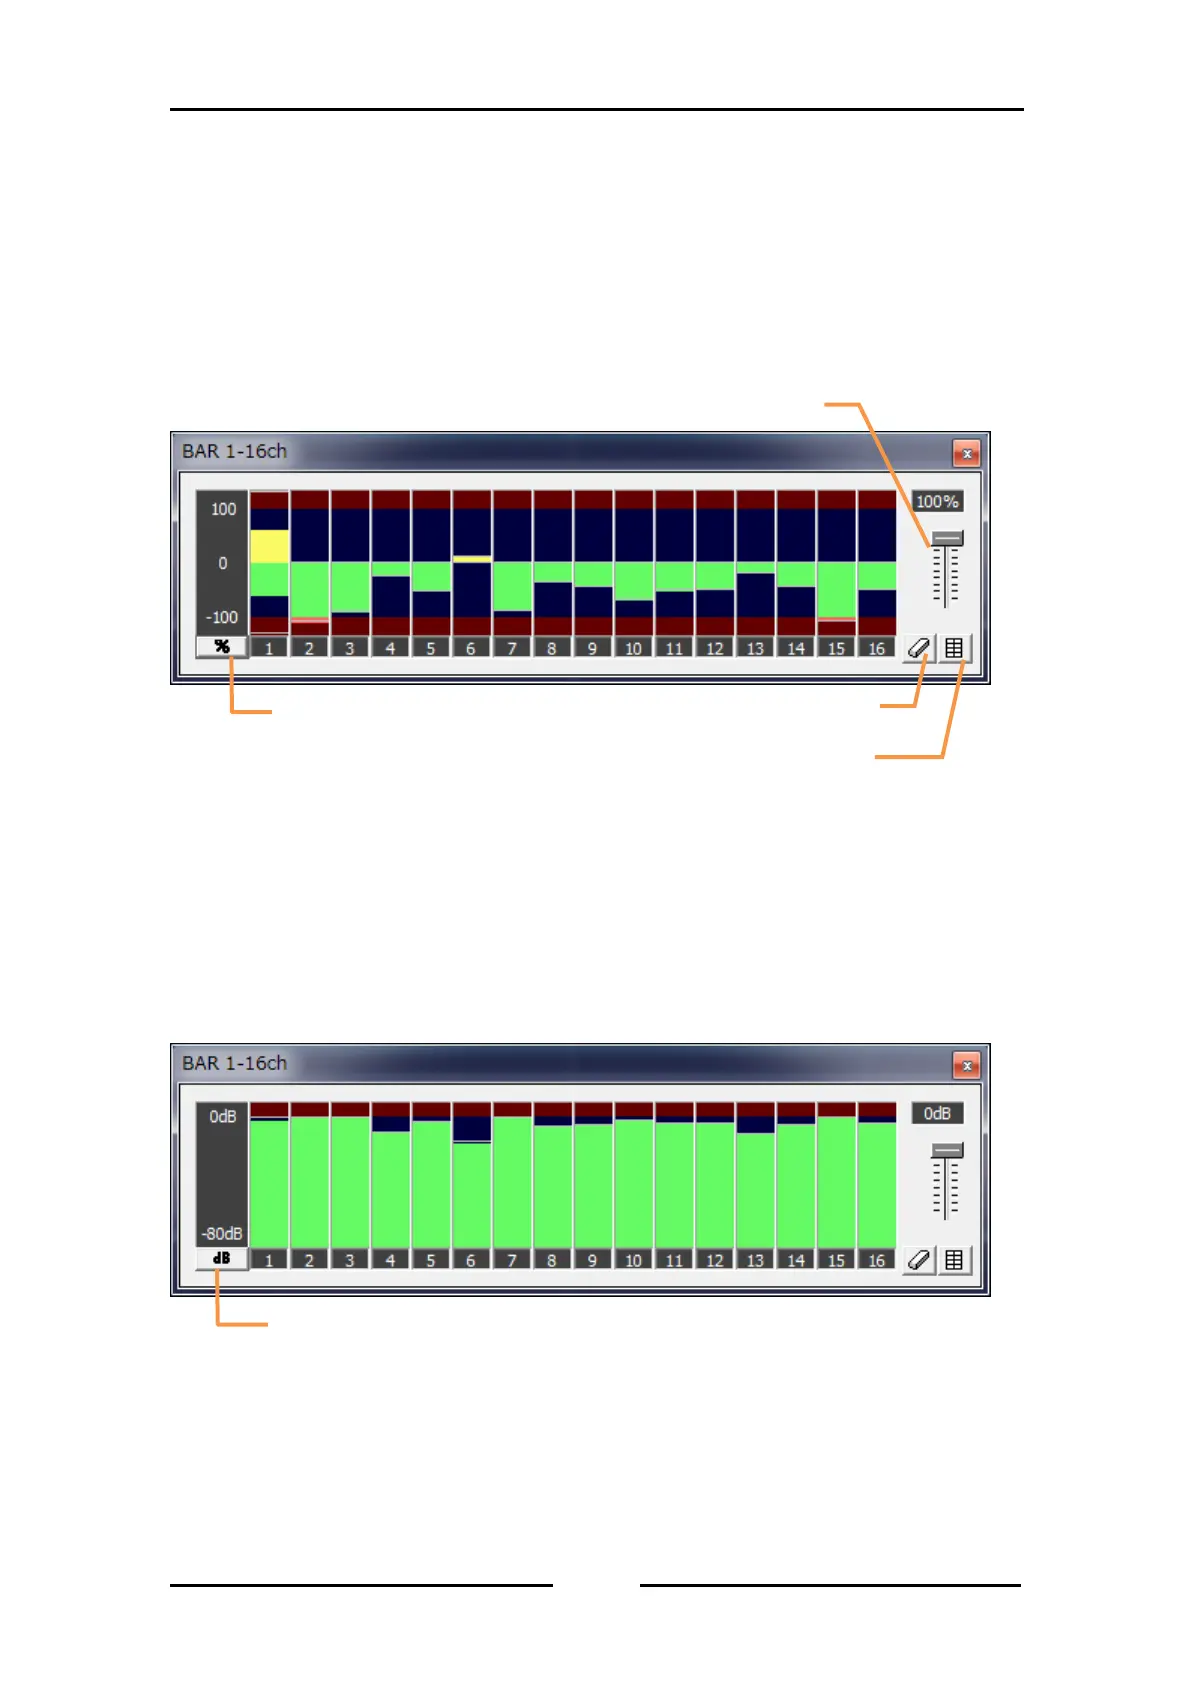
9.1.2. Unit select button
This button toggles the unit of the bar graph between “%” and “dB”.
Below figure shows “dB”.
Red-zone adjustment slider
Bar graph arrangement button
 Loading...
