Display Wavefor
mData
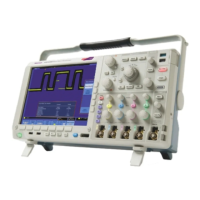
8. To group some or all of the d igital channels
together, move the channels right next to
each other. A l
l the channels that are next to
each other automatically form a group.
You can see the groups by pushing Select
on the side me
nu and turning m ultipurpose
knob a.
When a group is selected, turn multipurpose
knob b to move
the whole group.
Viewing Dig
ital Channels
The various ways of displaying data from the digital channels help you analyze the signals. Digital channels store a high or
low state for each sample.
Logic high levels are displayed in green. Logic low levels are displayed in blue. When a single transition occurs during the time
represented by one pixel column, the transition (edge) is displayed in gray.
When multiple transitions occur during the time
represented by one pixel column, the transition (edge)
is displayed in white.
When the display shows a white edge, indicating multiple
transitions, you may be able to zoom in and see the
individual edges.
When you are zoomed in so far that there is more than
one pixel column per sample, the uncertainty of the edge
position is indicated by l ight gray shading.
NOTE. When the light gray shading is displayed, use
MagniVu.
Annotating the Screen
You c
an add your own text to the screen by doing the following:
1. Push
Utility.
102 MSO4000B and DPO 4000B Series Oscilloscopes User Manual
 Loading...