292
The FFT Display
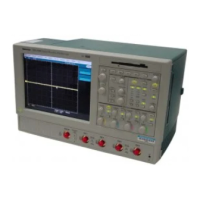
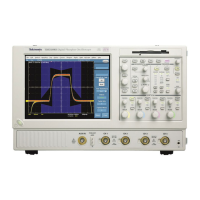
The following illustration shows a typical time-domain waveform and the frequency components
of that signal as part of the math FFT waveform.
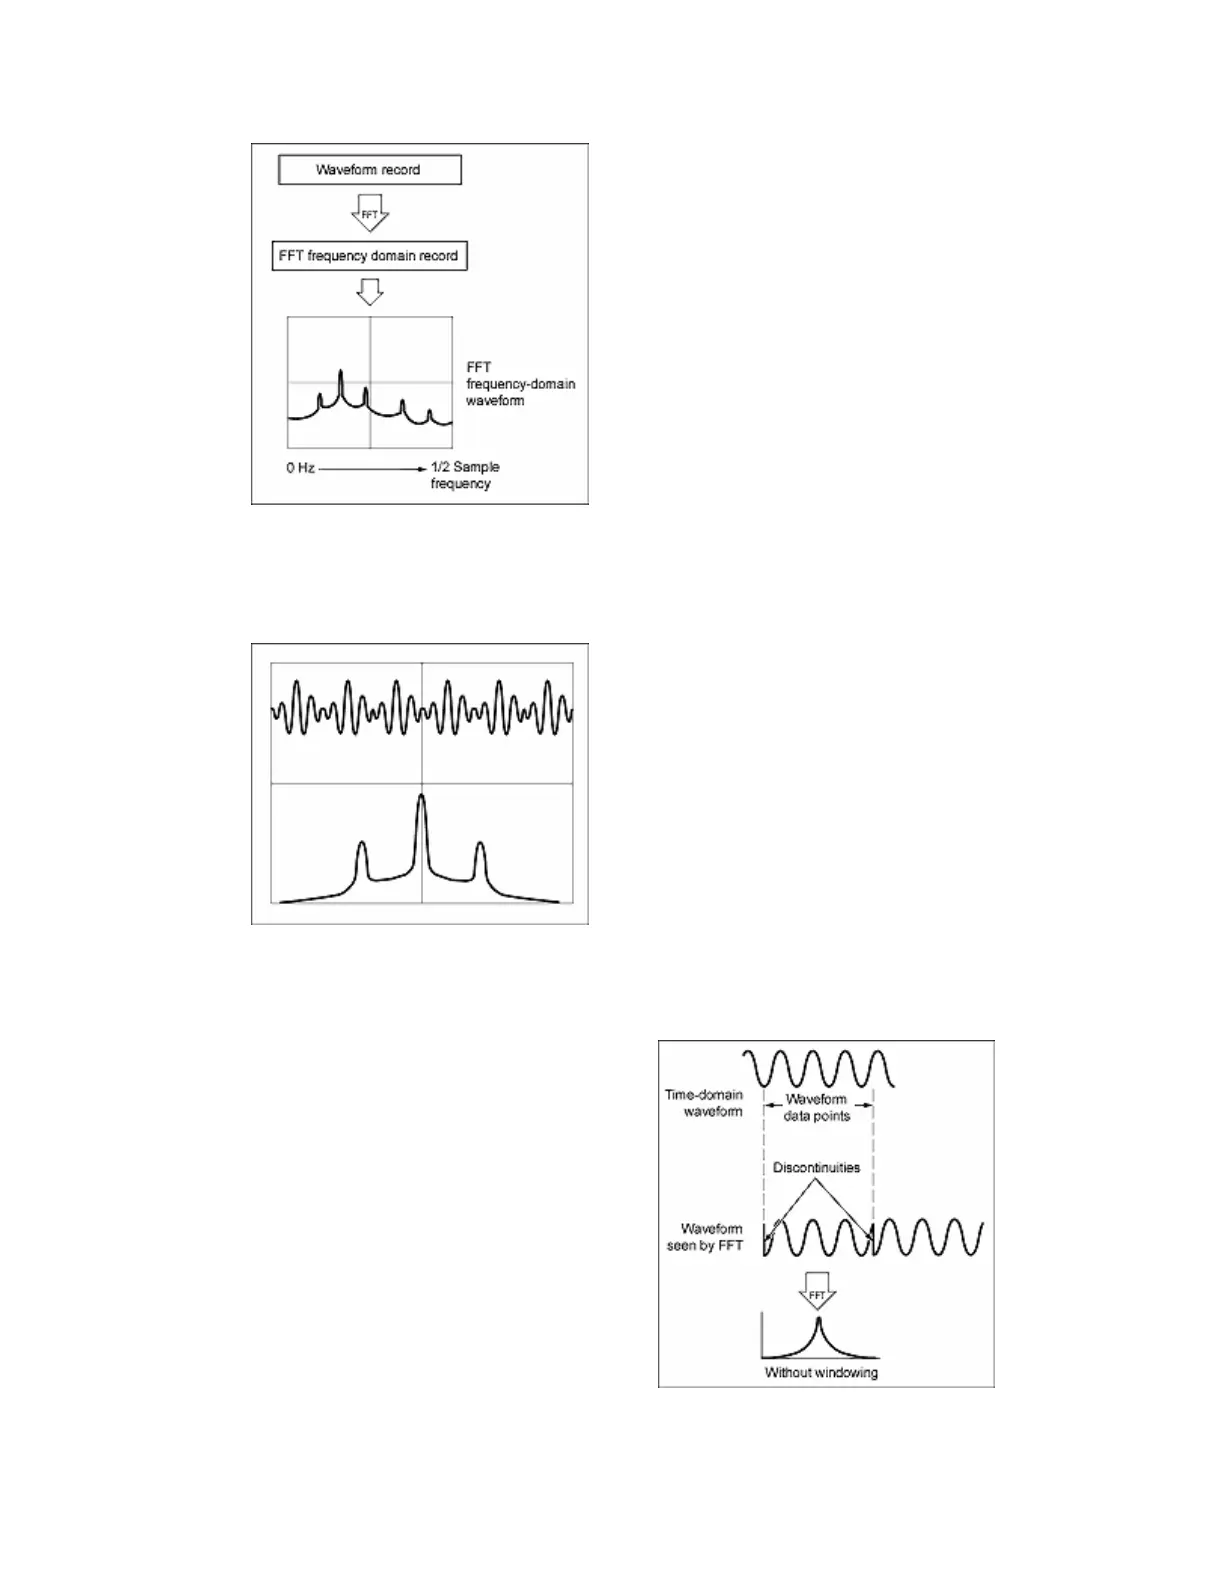
FFT Windows
The FFT process assumes that the
part of the waveform record used for
FFT analysis represents a repeating
waveform that starts and ends at or
near the same voltage of a cycle. In
other words, it is an integer number
of cycles. When a waveform starts
and ends at the same amplitude, there
are no artificial discontinuities in the
signal shape, and both the frequency
and amplitude information is
accurate.
A nonintegral number of cycles in
the waveform record causes the
waveform start and end points to be
at different amplitudes. The
 Loading...