283
Turn on averaging for a math waveform by editing the math expression. Sometimes, it is more
desirable to average in the spectrum than in the time domain. For example, consider a signal that
has time domain components that are asynchronous to the trigger. If you turn on averaging in the
time domain, these components may go to zero or produce strange, nondeterministic effects on the
resultant waveform. Thus, these signal components may end up not appearing in the spectrum.
However, if averaging is done in the frequency domain instead, then these components will be
present.
Recognizing Aliasing
Aliasing occurs when the input frequency of a signal is greater than one half of the sampling
frequency (the sample rate).
Set the sample rate high enough so that the signals in the spectrum appear at their correct
frequency as opposed to a lower aliased frequency value. Also, complex signal shapes that have
many harmonics in them, such as a triangle or square wave, can appear to be OK in the time
domain when in fact many of the harmonics in that signal are aliased.
One way to check for aliasing is to increase the sample rate and observe whether any of the
harmonics unwrap to different frequency locations.
Another way to recognize aliasing is to realize that higher order harmonics usually have
decreasing magnitudes compared to lower order harmonics. Thus, if you see a series of increasing
harmonic magnitude values as frequency increases then you can suspect that they may be aliased.
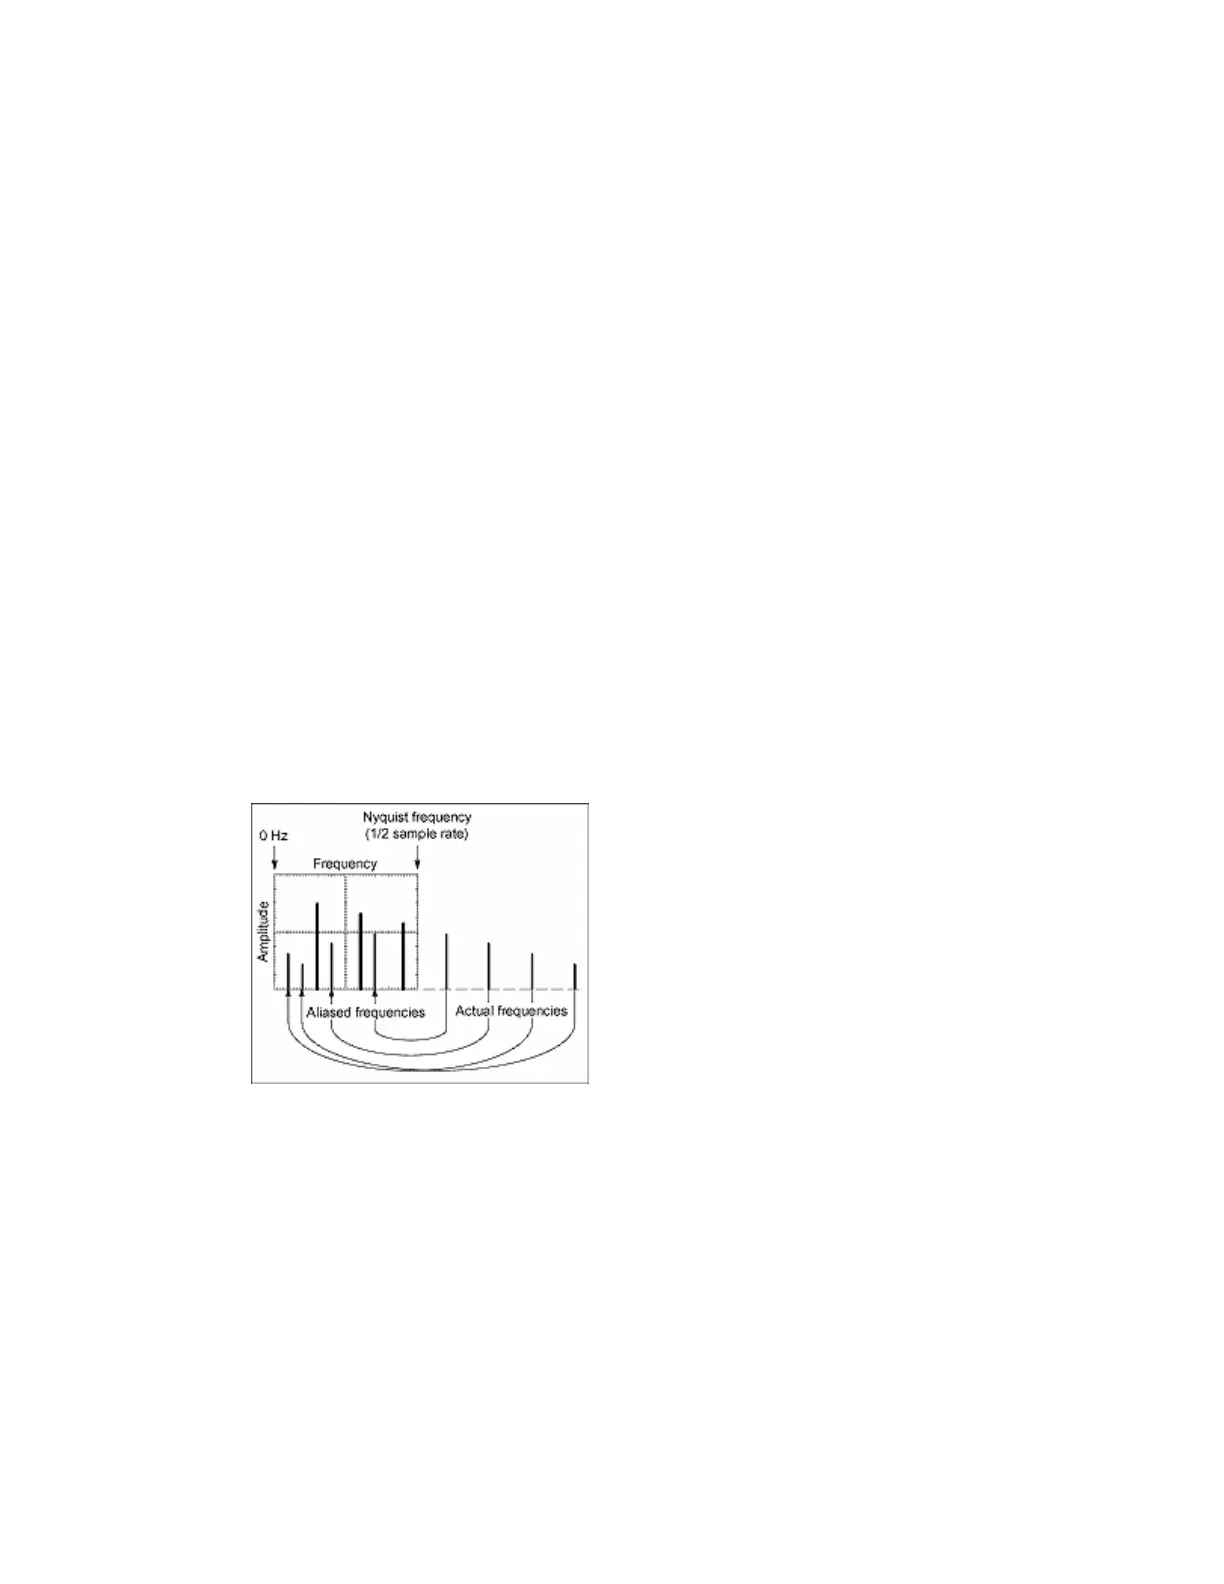
In the spectral math waveform, the actual higher frequency components are undersampled, and
therefore they appear as lower frequency aliases that "fold back" around the Nyquist point. (See
figure below.) You may test by increasing the sample rate and observing if aliases unwrap to
different frequency positions.
If you have a variable-frequency signal source, another way to observe aliasing is to adjust the
frequency slowly while watching the spectral display. If some of the harmonics are aliased, you
will see the harmonics decreasing in frequency when they should be increasing or vice versa.
Once you have displayed a spectral math waveform, use cursors to measure its frequency
amplitude or phase angle. See Setting Cursor Sources on page 326 for detailed steps.
You can use automated measurements to measure spectral math waveforms. See Taking
Automatic Measurements on page 323 for step-by-step instructions.
Serial Mask Testing with Option SM
Serial Mask Testing (Option SM) provides electrical mask testing on communication standards
and communication triggering.
 Loading...