EasyManuals Logo
Home>Texas Instruments>Calculator>TI-Nspire

Texas Instruments TI-Nspire User Manual

Texas Instruments TI-Nspire
144 pages
To Next Page IconTo Next Page
To Previous Page IconTo Previous Page
Page #115 background imageLoading...
Page #115 background image
Using Data & Statistics 107
Using Data & Statistics
The Data & Statistics application provides tools to:
visualize sets of data in different types of plots.
directly manipulate data sets to explore and visualize data
relationships. Data changes in one application are dynamically
applied to all linked applications.
explore central tendency and other statistical summary techniques.
fit functions to data.
create regression lines for scatter plots.
graph hypothesis tests and results (z- and t-tests) based on summary
statistics definitions or data.
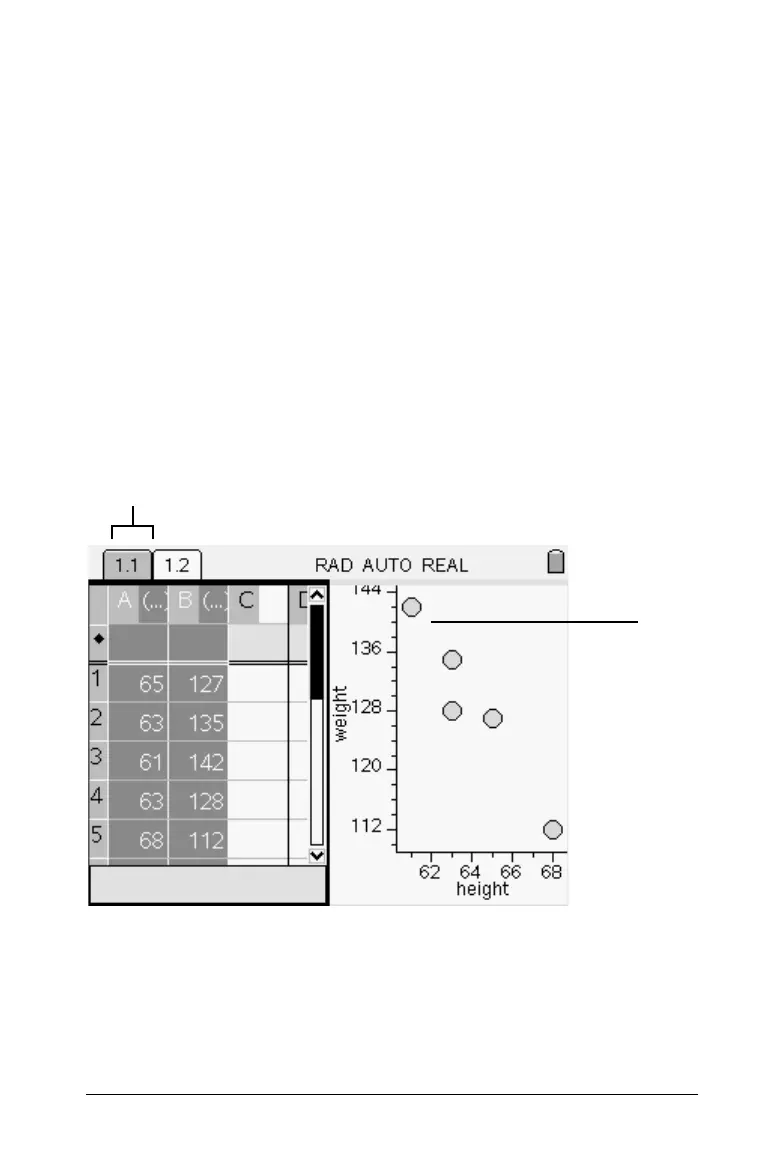
Note: In the following example, Lists & Spreadsheet is shown along with
Data & Statistics. This represents a typical page set-up.
À Problem/Page number counter
Á Sample Data & Statistics work area
Á
À

Table of Contents

Other manuals for Texas Instruments TI-Nspire

Questions and Answers:

Question and Answer IconNeed help?

Do you have a question about the Texas Instruments TI-Nspire and is the answer not in the manual?

Texas Instruments TI-Nspire Specifications

General IconGeneral
TypeDisplay
Form factorPocket
Product colorBlue, White
Display resolution320 x 240 pixels
Display size (HxV) (imperial)0 \
Compatible operating systemsWindows Vista/XP Mac OS X 10.4/10.5
Battery typeAAA
Number of batteries supported4
Weight and Dimensions IconWeight and Dimensions
Dimensions (WxDxH)100 x 198.3 x 28.7 mm

Related product manuals