86 Using Graphs & Geometry
Using the entry line
To enter a function on the entry line:
1. Select the mode.
2. Type the function you want to graph in the space at the right of the
= sign.
3. Press
· or e.
You can enter and graph a maximum of 99 functions on the screen (f1(x)
- f99(x) ) in addition to any user-named functions such as g1(x). You can
review the functions entered on a page by pressing the Expand button.
Use 9 and : to move up and down the list.
You can also graph functions by typing them into a text box.
f Select the Text tool ( ), and type the function you want to graph
into the box displayed when you move the curson onto the page.
f Drag the text box to the x-axis, and drop it on the axis to graph the
function.
Regardless of how you enter functions, each function is labeled on the
graph for identification.
Graphing inequalities
Function mode enables you to define a function that uses a symbol other
than the equal sign. To change = to a different sign and graph the
inequality:
1. Position the cursor to the right of the equal sign.
Press
. to delete the equal sign.
2. Type the desired sign or use the Symbol Palette to enter the
appropriate inequality. The possible inequalities are: >, +, {, and |.
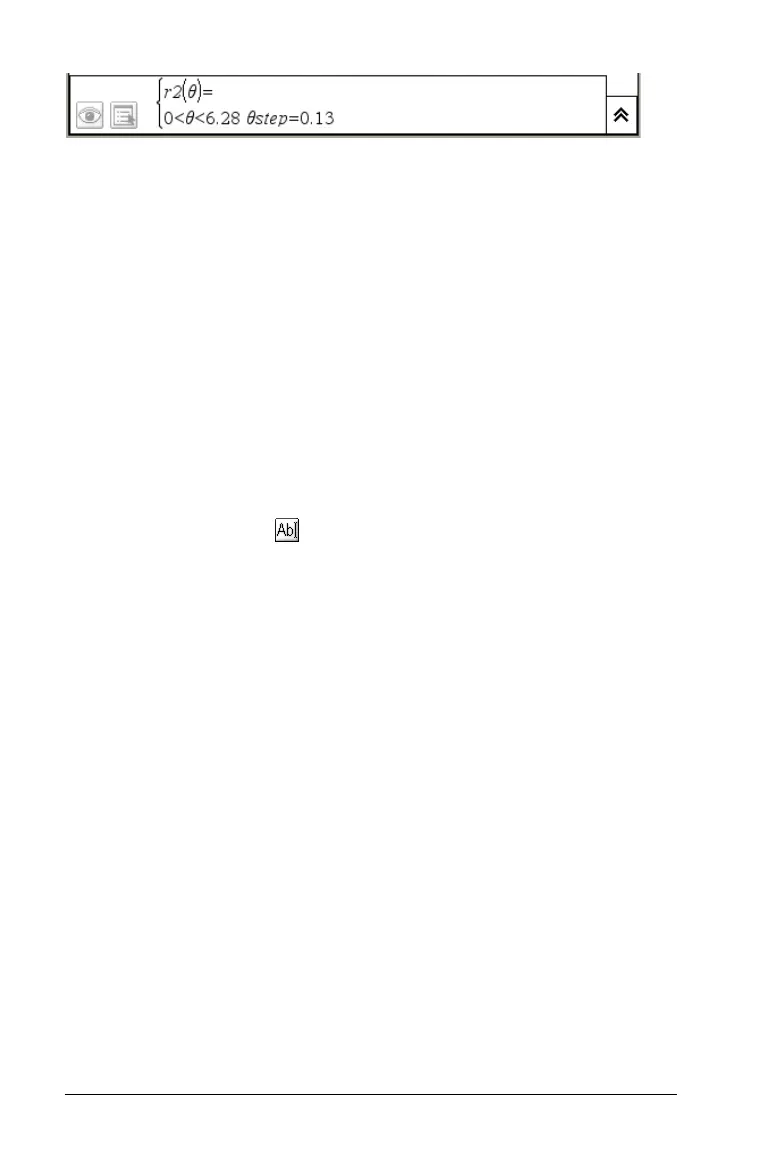
Polar Mode entry line

 Loading...


