90 Using Graphs & Geometry
Creating a Scatter Plot
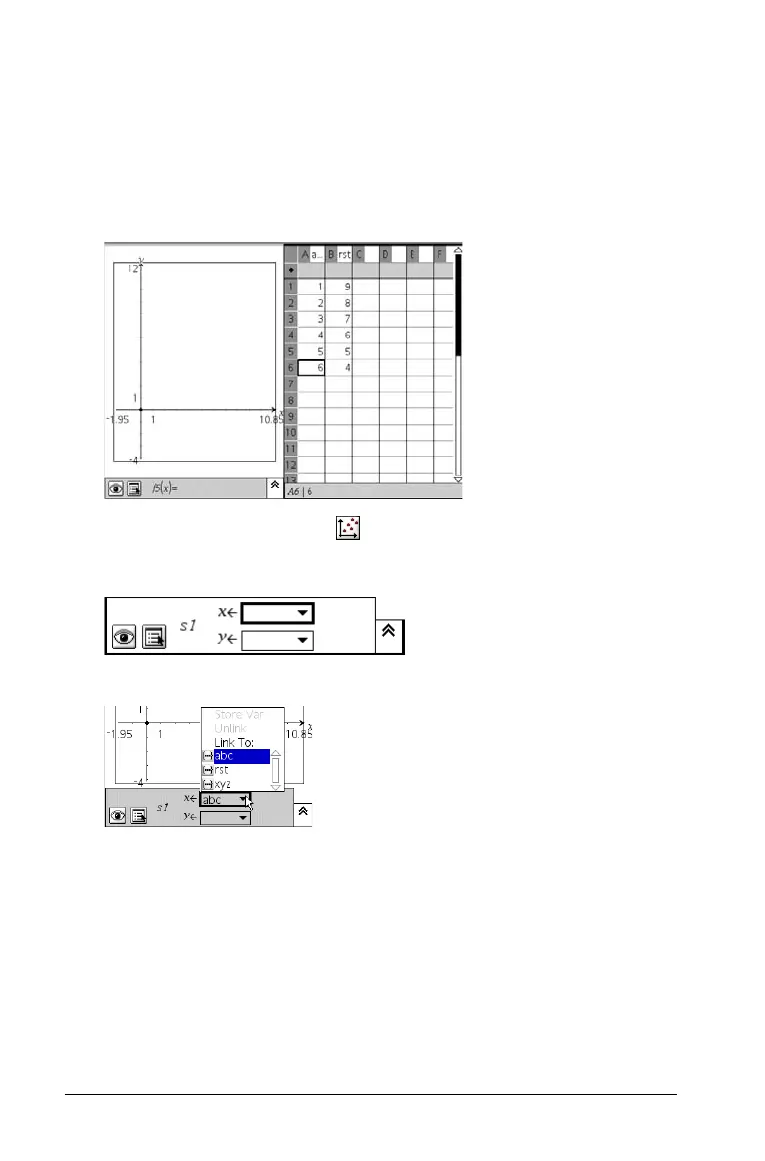
If you do not have an existing set of data points available for plotting,
create them on the same page using the Lists & Spreadsheet application.
1. To create the data lists and scatter plot on the same page, select a
page configuration with two work areas.
2. Create the data lists on the Lists & Spreadsheet portion of the page.
3. Select the Scatter Plot tool ( )
Press b 3 3.
4. Select the lists to plot from the drop down list for each axis.
5. When both entry fields have a data list specified, the scatter plot
displays on the Graphs & Geometry work area.

 Loading...


