114 Using Data & Statistics
The data plot functions as follows:
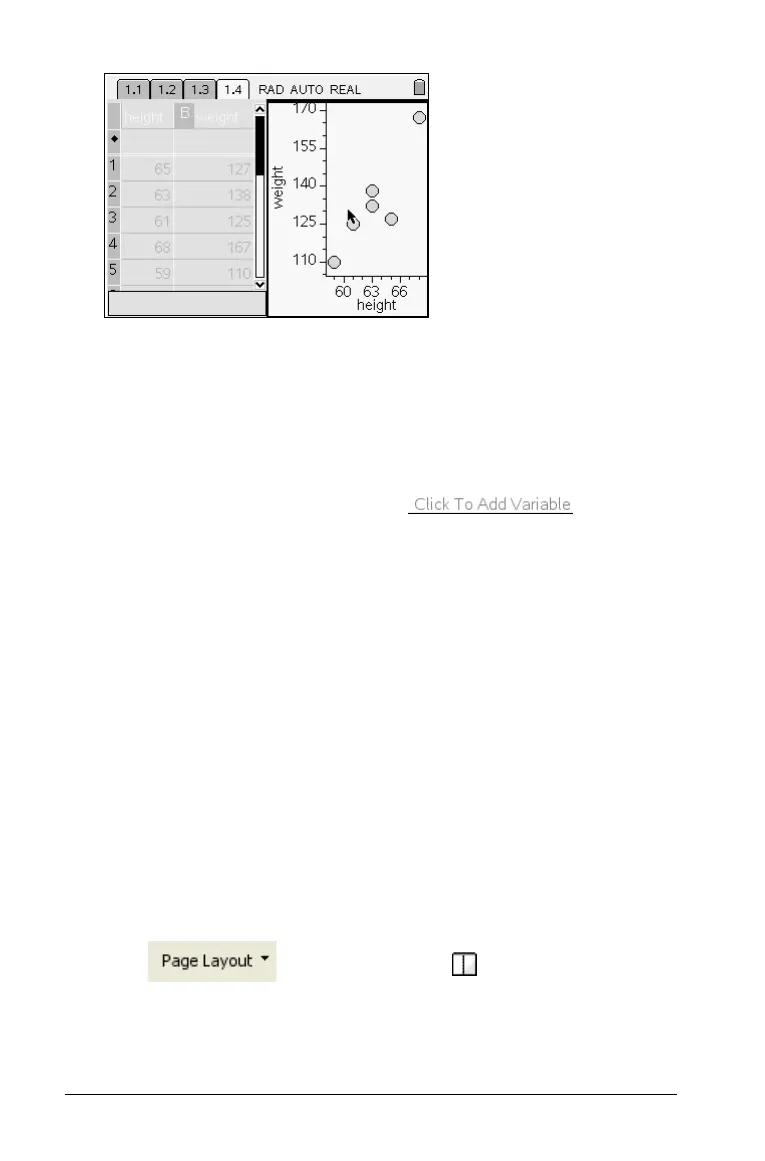
– If you select only one column of data, it displays as a dot plot on
the horizontal axis. The column name appears as the horizontal
axis label.
– If spreadsheets in the problem contain multiple named lists, you
can view the names of lists in the problem by positioning the
mouse over an axis and clicking . Remove
the plotted variable and click on the name of any list to replace
the data plotted on the axis with the data in the selected list.
– If there are less than four work areas on the page, TI-Nspire adds
a new work area with Data & Statistics active on it.
– If four work areas are already defined on the page, TI-Nspire
adds a new page to the problem with Data & Statistics active on
it.
Note: If a list is defined with a formula in Lists & Spreadsheet, the
points in Data & Statistics may not move, due to the formula’s
restriction. The dots in Data & Statistics will only move in directions
allowed by their definition, so if they are just data they will move
freely. If the points are y=x, they will move along the line.
Creating a split page with Data & Statistics and Lists &
Spreadsheet
1. Add the Lists & Spreadsheet or Calculator application to a new page
or problem.
2. Click and select Layout 2 , to split the page into
two work areas.
Press:
/c622

 Loading...


