Using Graphs & Geometry 85
Move the cursor away from this point. A circle with a dotted
circumference line emerges as you move the cursor.
3. When the circle has the radius you desire, click again.
The dotted circumference changes to a solid circumference in the
work area.
Note: If you hold down the g key when creating the circle, the radius
is limited in length to integers.
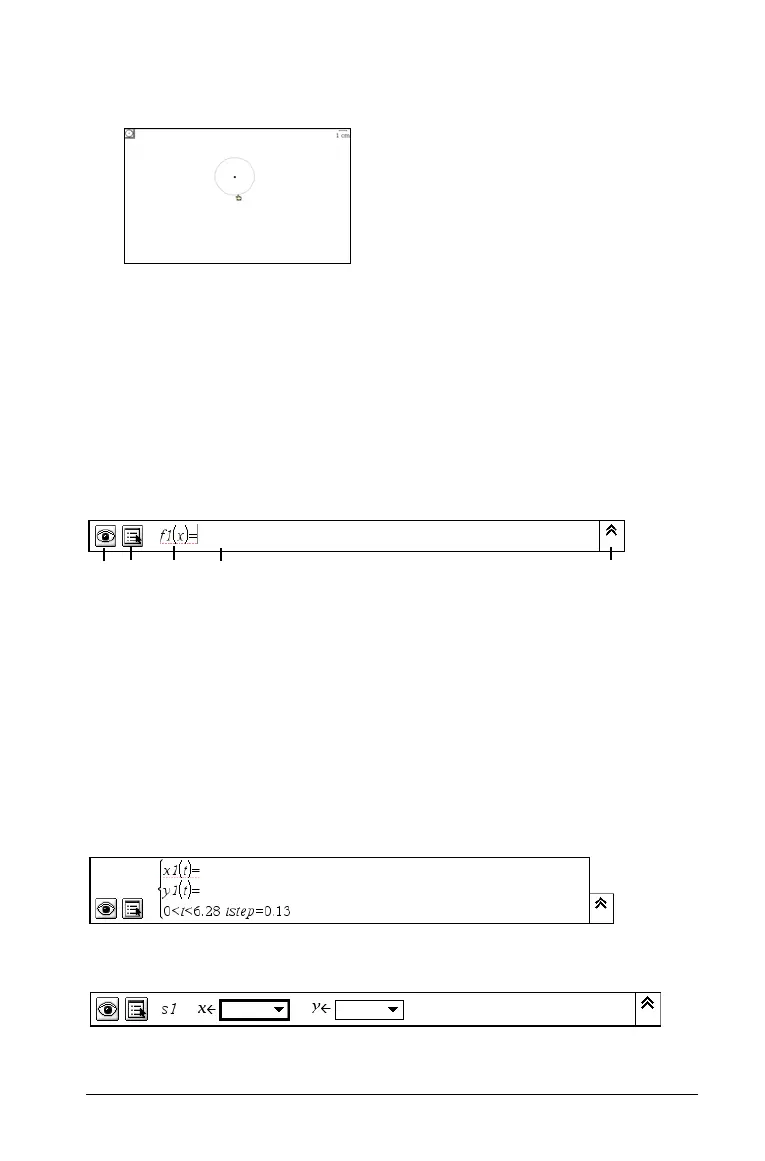
The entry line
The Entry line appears at the bottom of the Graphs & Geometry work
area.
When the line is not active, it is grayed out. From left to right, the parts
of this line are:
À Hide/Show function button.
Á Attributes button.
 f1(x)= is the default notation used for a function or inequality.
à Blank area into which you enter the function, polar equation,
inequality, parametric, or scatter plot data to be graphed.
Ä Expand/Contract (History) button.
ÀÁ Â Ã Ä
Parametric Mode entry line. The default values for t-min, t-max, and t-step
are shown.
Scatter Plot Mode entry line

 Loading...


