72 Using Graphs & Geometry
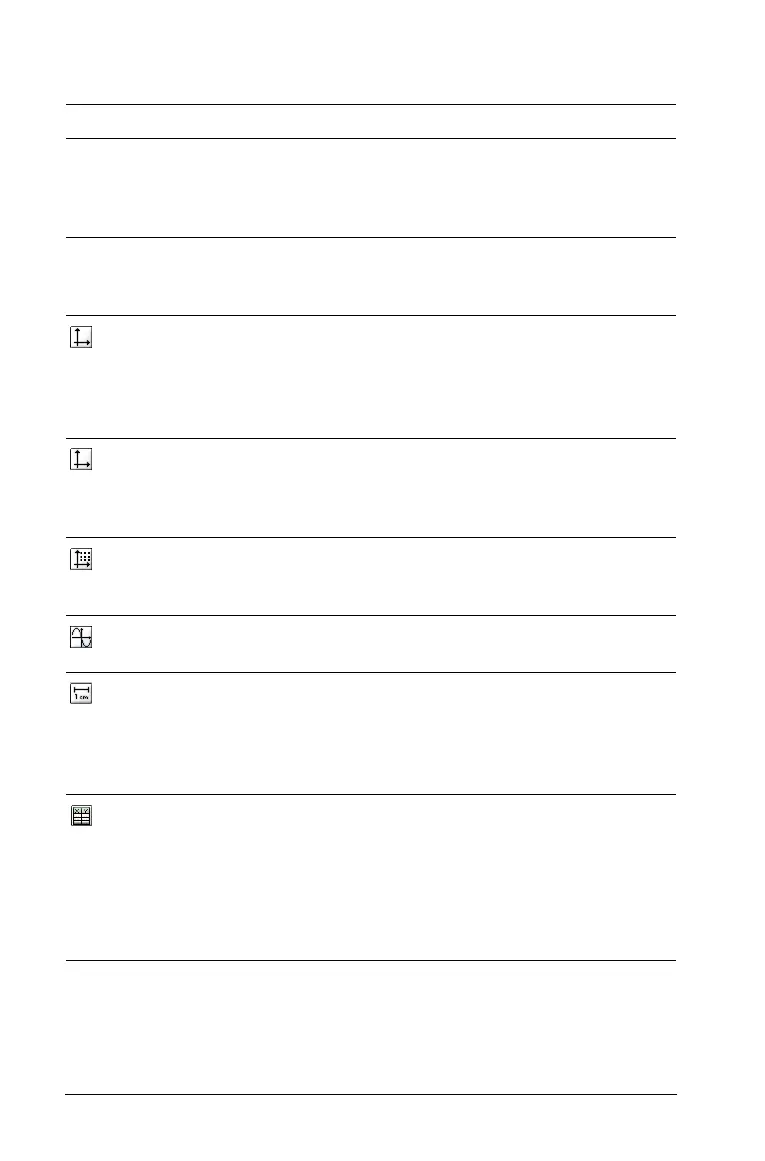
View Menu Tools
Tool name Tool function
1: Graphing Places the work area in graphing mode. Axes fill
the work area, and the entry lines displays at the
bottom of the screen. This is the default display
when Graphs & Geometry is added to a page.
2: Plane
Geometry
Places the work area in geometry mode. Show
scale displays, but no axes, grid, or entry line
displays.
3: Show
Analytic
Window
Opens a small graphing window on a plane
geometry work area. Places the Graphs &
Geometry work area in modeling mode. This
tool can be used only after Plane Geometry is
selected.
4: Hide (Show)
Axes
Hides the axes if they are currently displayed on
the page. Displays the axes if none are displayed
on the page. Cartesian axes are the supported
axes.
5: Show (Hide)
Grid
Turns the grid on or off on the page. Objects can
be attached to the grid when the grid is
displayed.
6: Hide (Show)
Entry Line
Hides or displays the entry line on the page.
7: Show (Hide)
Scale
Toggles between showing and hiding the scale
legend on the work area. When the scale is
shown, the value and/or units can be changed to
desired values/units. This applies only to
geometric constructions.
8: Add Function
Table
Launches the Lists & Spreadsheet function table.
When launched from Graphs & Geometry, it is
pre-populated with all functions defined in the
problem with the exception of hidden functions.
More information on using Function Tables is
available in the Lists & Spreadsheet chapter of
this document.

 Loading...


