41
BASIC OPERATIONS
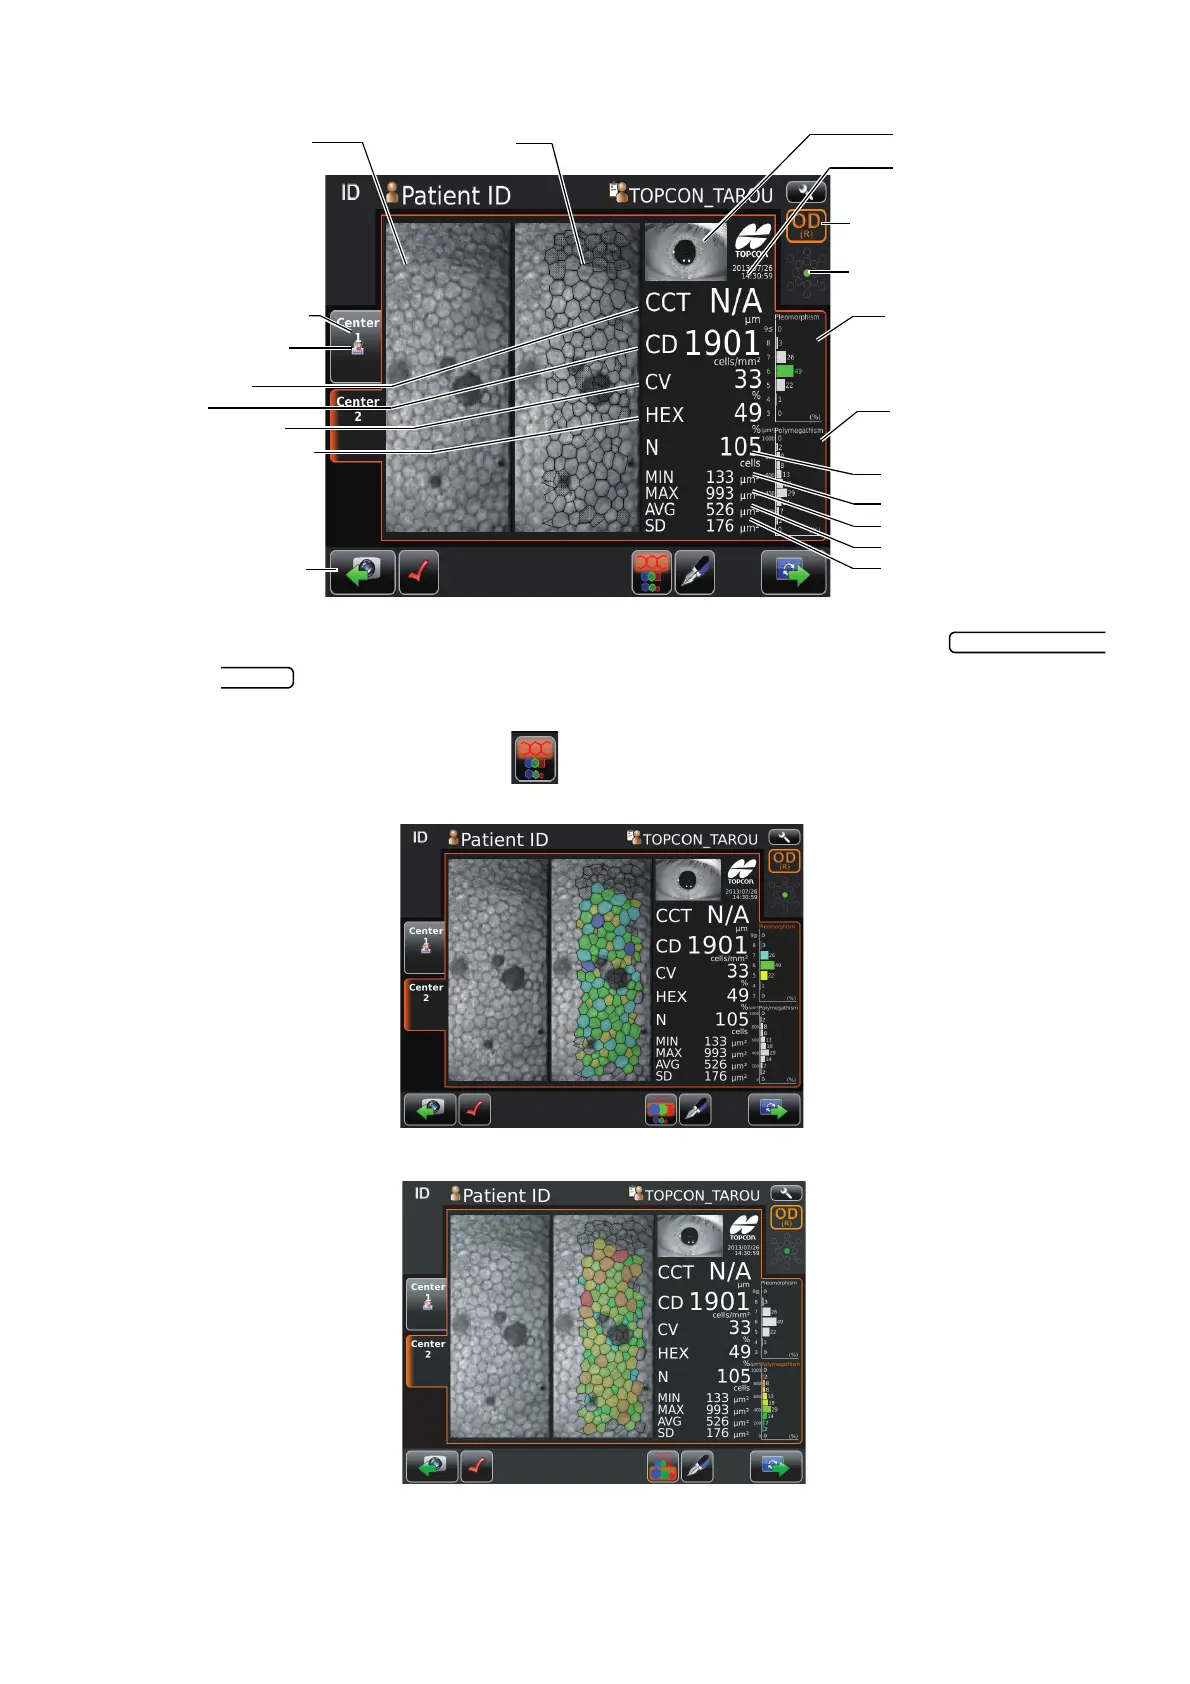
Results of Photography and analysis.
• If photography is required again, return to the capture screen by tapping
. Then you can photograph again.
• The analyzing image is classified in color according to number of angle of cell and area of
cell by tapping overlay button .
The analyzing image is classified in color according to number of angle of cell
The analyzing image is classified in color according to area of cell
• The cell that is no colored and displayed with black boundary line and dot is excluded from
analyzed value calculation.
Corneal endothelium image
(basis image)
Analyzing image
Print/Output reservation
mark
Corneal thickness
Cell density
Coefficient of variation
Frequency of hexagon cells
Anterior image
Date of photographing
Square-shaped
distribution graph
Area distribution graph
Number of cell analyzed
Minimum cell area
Maximum cell area
Average cell area
Standard deviation of cell
area
Photographing position display
OD button/OS button
Photographing position tab
Rephotographing button