56
-EN
TOUCH SCREEN CONTROLLER for Air Conditioning Control System Owner's Manual
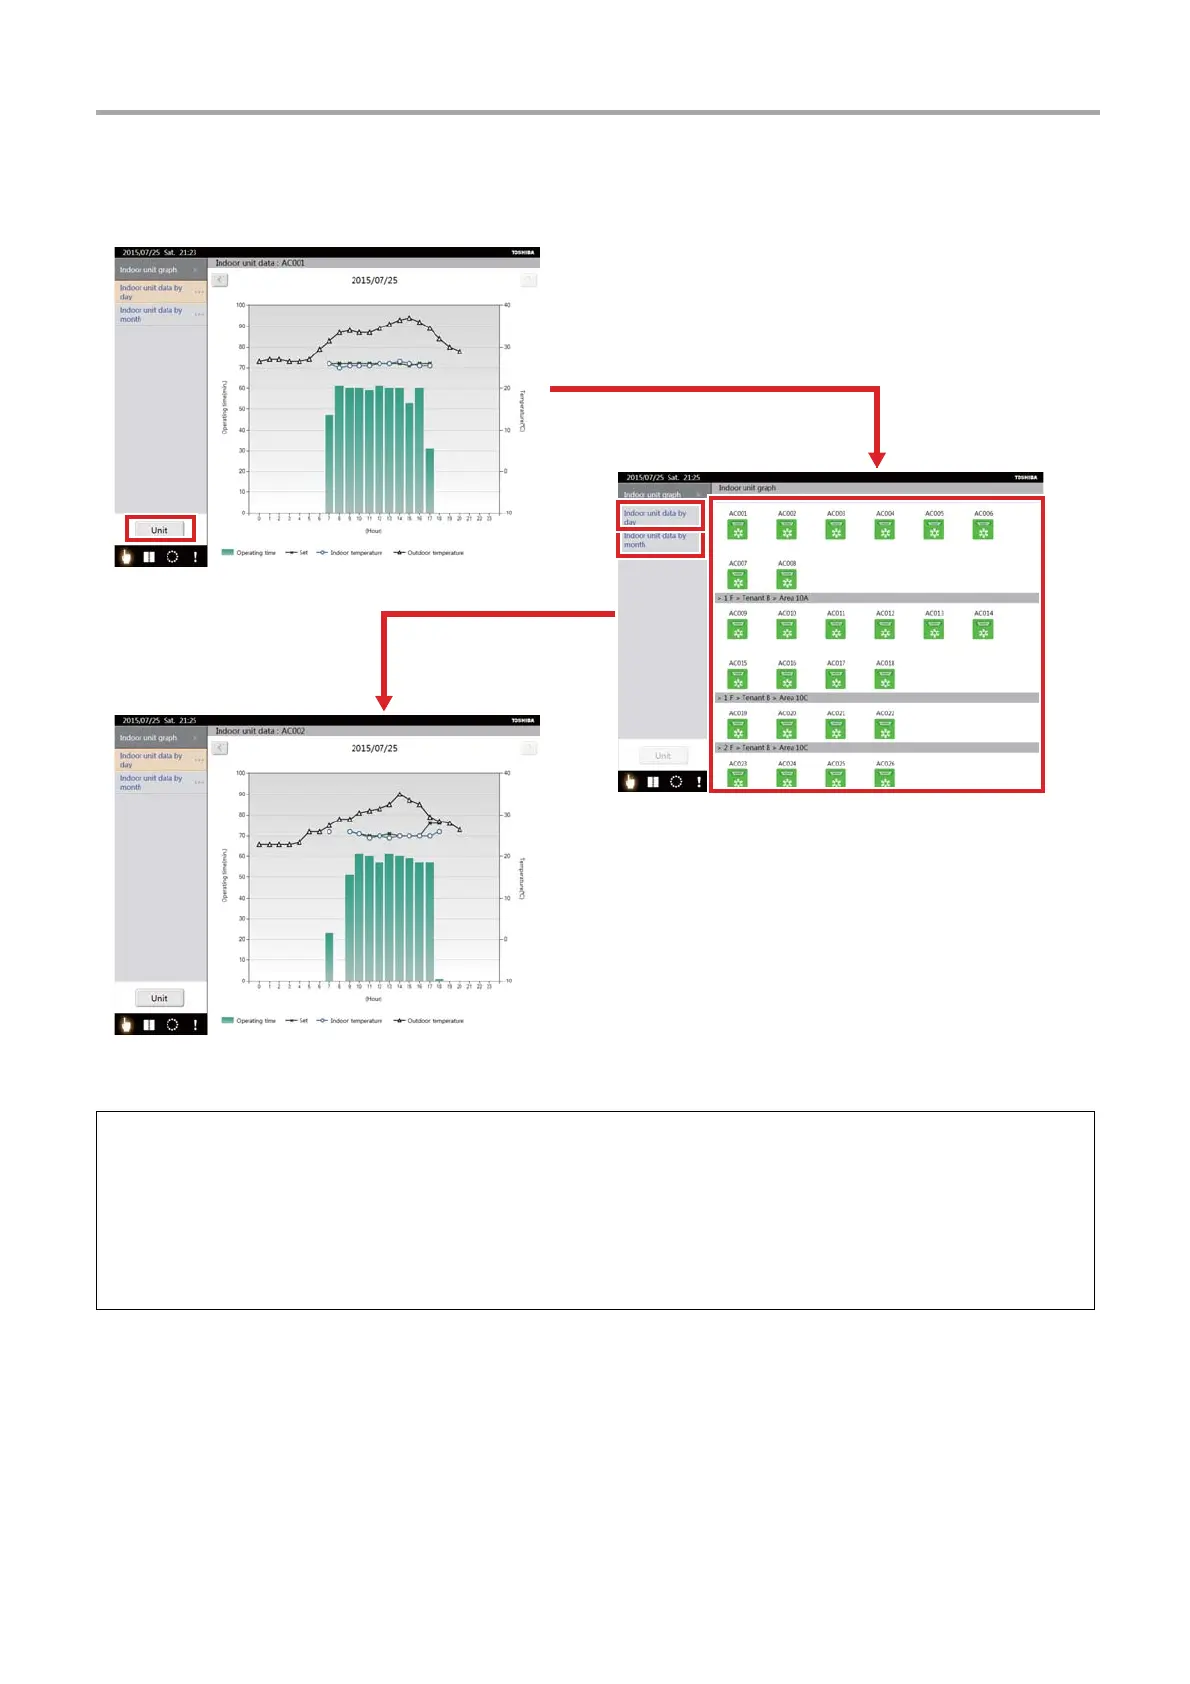
[3] Displaying the graphs of other indoor units
(1) Tap the [Unit] button <1>.
The screen changes to the group selection screen.
(2) From the Unit display of the icon
<2>, select the group icon that you want to make into a graph.
(3) Tap [Indoor unit data by day]
<3>. (When you want to display by month, tap [Indoor unit data by month] <4>.)
The indoor unit graph of the selected icon appears.
* When multiple air conditioners are selected, the operating time is a total value and the set temperature, indoor temperature,
and outdoor temperature are average values.
<1>
<2>
<3>
<4>
[Indoor unit graph by day screen]
[Group icon selection
screen]
[Indoor unit graph by
day screen]
When indoor unit data by day is selected
 Loading...