60
-EN
TOUCH SCREEN CONTROLLER for Air Conditioning Control System Owner's Manual
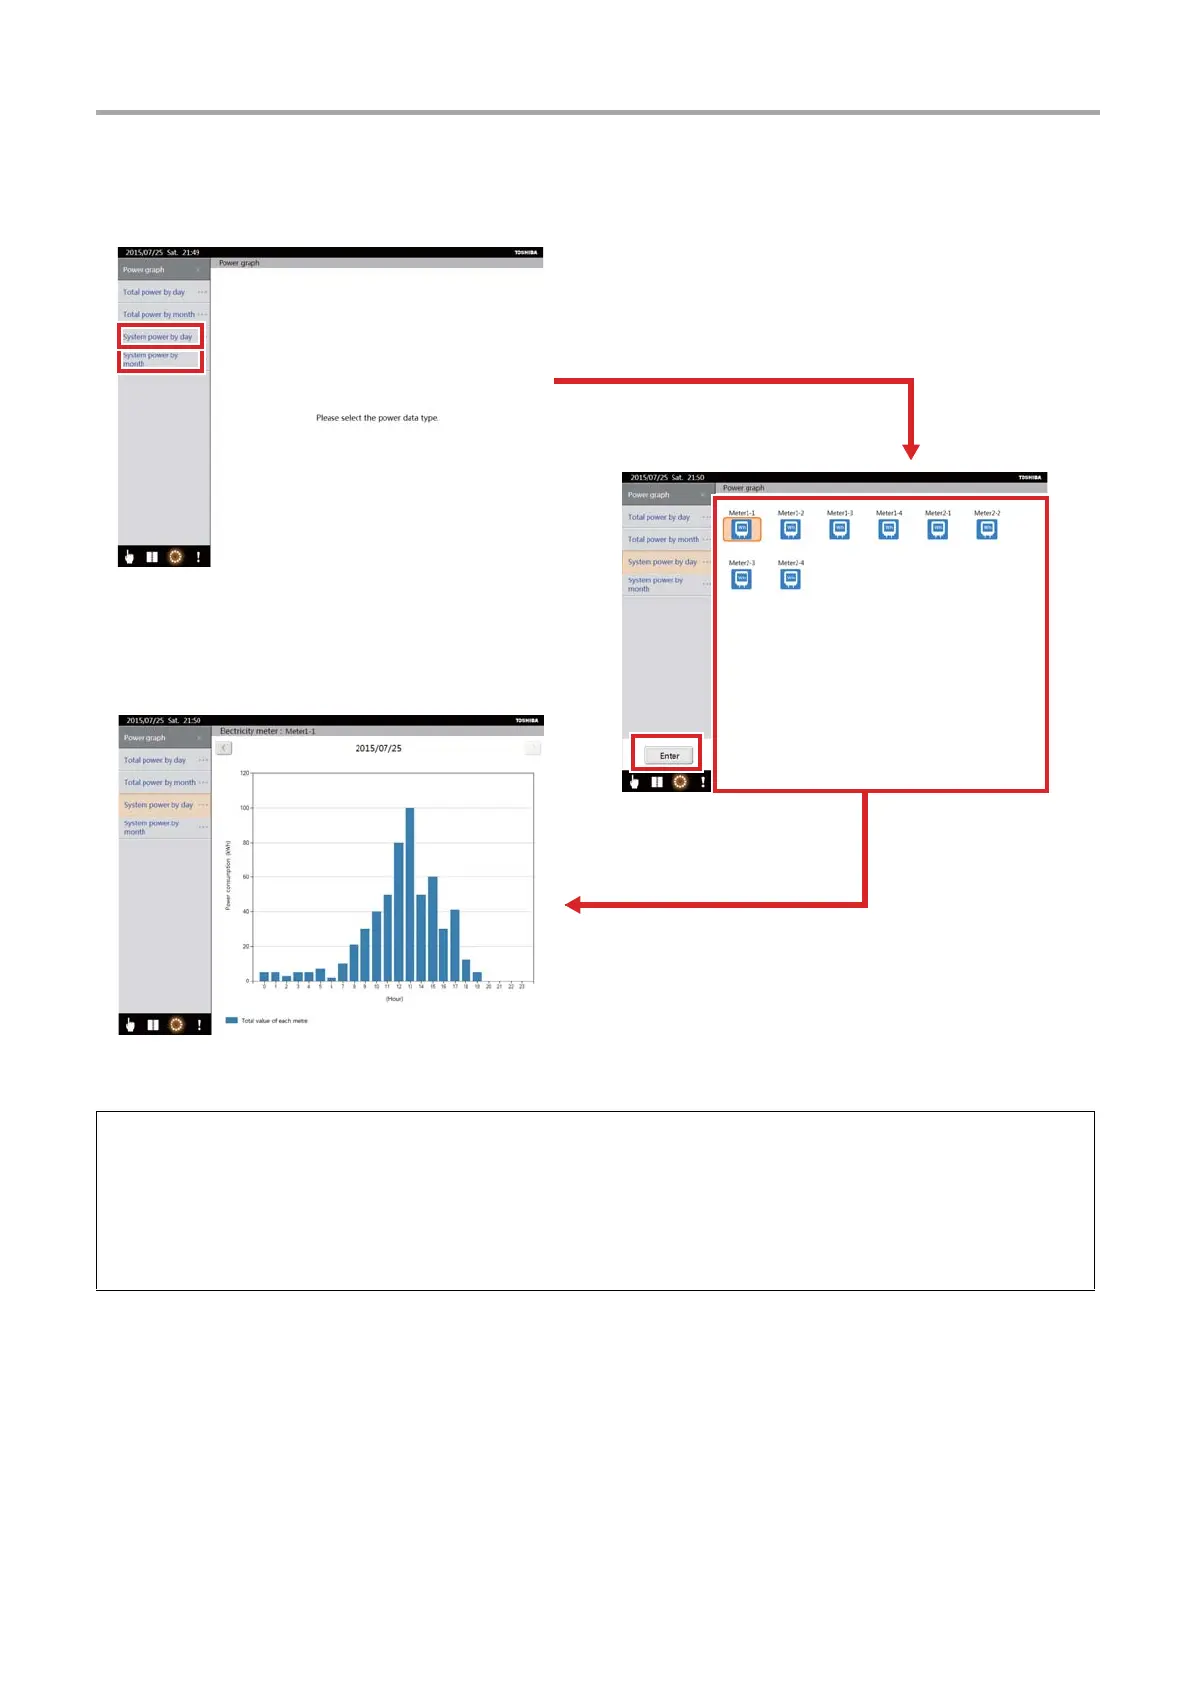
[3] Displaying the system power graph
(1) Tap [System power by day] <1>. (When you want to display by month, tap [System power by month] <2>.)
The electricity meter icon appears.
(2) Select the Electricity meter icon
<3> that you want to make into a graph. (More than one can be selected)
(3) Tap the [Enter] button
<4>.
The system power graph is displayed.
* When multiple electricity meters are selected, it is a total value of the selected electricity meters.
[Power graph screen]
[Electricity meter
selection screen]
[System power graph by
day screen]
 Loading...