86
CDHH-SVX003C-EN
Start-up and Shutdown
This section provides basic information on chiller operation
for common events.
Sequence of Operation
Adaptive control algorithms are used on CenTraVac™
chillers. This section illustrates common control
sequences.
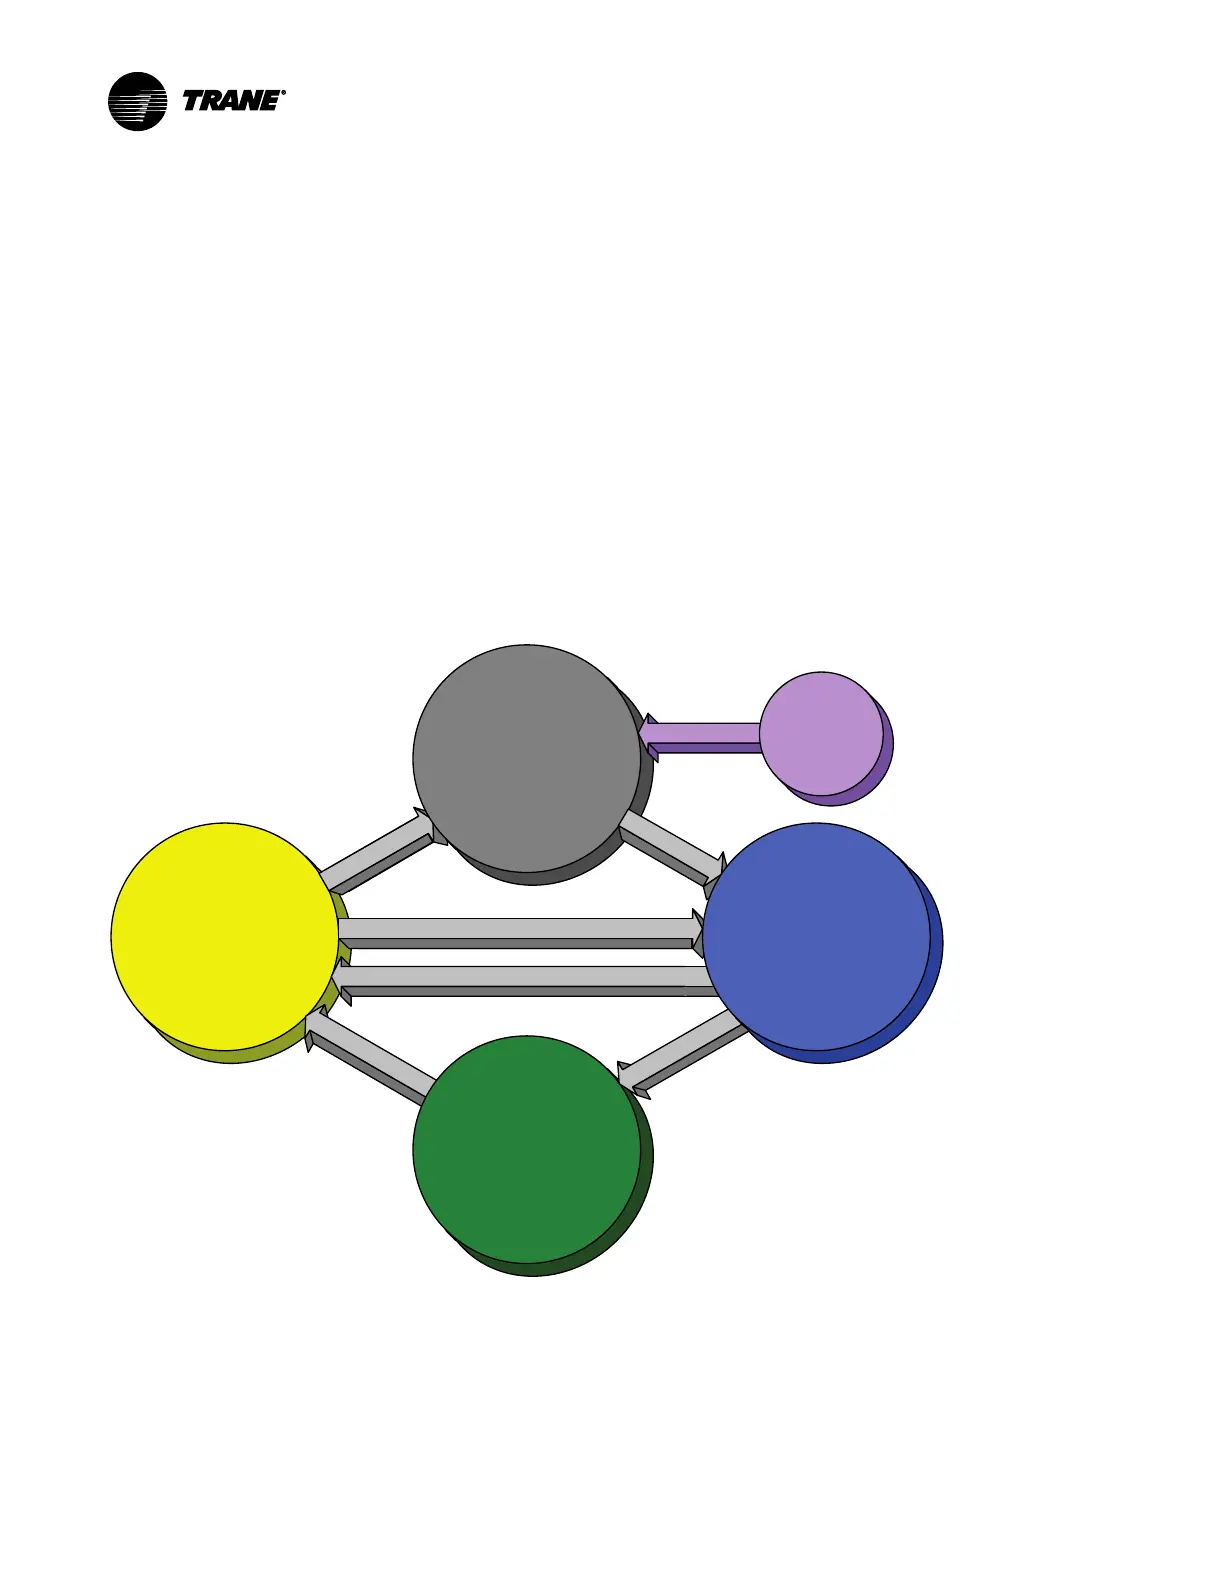
Software Operation Overview Diagram
The following figure is a diagram of the five possible
software states. This diagram can be thought of as a state
chart, with the arrows and arrow text, depicting the
transitions between states:
• The text in the circles is the internal software
designations for each state.
• The first line of text in the circles is the visible top level
operating modes that can be displayed in Tracer
®
AdaptiView™.
• The shading of each software state circle corresponds
to the shading on the time lines that show the chiller’s
state.
There are five generic states that the software can be in:
• Power Up
• Stopped
• Starting
• Running
• Stopping
Figure 59. Software operation overview
Confirmed
Shutdown
Stopped
Stopped
Run Inhibit
Stopping
Preparing to Shut Down
Shutting Down
Running
Running
Running—Limit
Starting
Auto
Waiting to Start
Starting Compressor
Power
Up
Start
Command
Diagnostic
Res
e
t
Fast Restart or Satisfied Setpoint
Stop Command or Diagnostic
Stop Command
Diagnosti
c
Start
Confirmed
In the following diagrams:
• The time line indicates the upper level operating mode,
as it would be viewed in the Tracer
®
AdaptiView™.
• The shading color of the cylinder indicates the software
state.
• Text in parentheses indicates sub-mode text as viewed
in the Tracer
®
AdaptiView™.
• Text above the time line cylinder is used to illustrate
inputs to the Symbio™ 800. This may include user
input to the Tracer
®
AdaptiView™ touch screen, control
inputs from sensors, or control inputs from a generic
BAS.