1. If needed, configure the color scales and the units in the Color Setup utility.
See IRIS and RDA Utilities Guide .
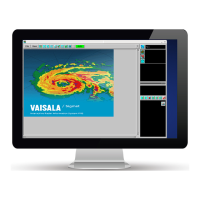
2. In the Quick Look Window, display a CATCH product.
3. To choose a display style, select Quick Look Window > Options
4. Right-click the mouse on a subcatchment
A bar graph appears showing the hourly precipitation accumulation for the integration
time.
5. To select the bar graph vertical scale, use the up and down indicators next to the top of
the scale.
Chapter 5 – Configuring and Scheduling Optional IRIS Products
RESTRICTED 127