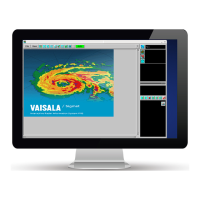
3.23 VIL: Vertically Integrated Liquid
Figure 33 VIL Example Configuration
VIL is a color-coded map of the estimated depth of water (in mm) contained in a selectable
atmospheric layer. This is an excellent indicator of severe storms.
Either Z or ZT can be used as the basis for the estimate.
VIL can compute several dierent values over an altitude interval or layer in the atmosphere,
including integrated liquid, or averaged reflectivity. These can be excellent indicators of
severe storm activity, especially with regard to the rainfall potential of a storm.
Because VIL can be set to look over the entire depth of the atmosphere, it is good at seeing
precipitation aloft that is not reaching the ground, which can be missed by a PPI or CAPPI.
If the layer height is above the freezing level, high VIL values are an excellent indicator of
severe storms and hail. If the layer height extends from the surface up to 3 km (1.9 mi), then
the VIL values serve as a forecasting guide as to how much precipitation is likely to fall
during the next few minutes.
When computing integrated liquid data (VIL-data), the output shows the estimated
precipitation (in millimeters) contained within the user-defined layer. This number is
sometimes also labeled in kg/m**2.
1. The VIL algorithm first searches out all points in the layer (accounting for earth
curvature) over a given range and at a given azimuth that intercept the PPI scans of the
volume scan, including one point above and below.
Chapter 3 – Configuring IRIS Products
RESTRICTED 93

 Loading...