5.8.1 Displaying SWS Data
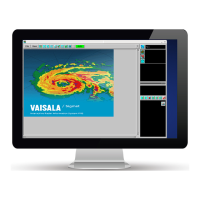
Figure 68 Example of Radar Data with an Overlay of SWS Station Plots
In the previous example, the individual station plots are drawn centered at the station
locations. All the stations in the display coverage area are shown.
In the IRIS station plot format, the plot is standardized, although dierent reporting stations
vary in measuring capabilities as well as in data the span and resolution. Individual numbers
or graphics are not shown on the plot if a station does report or if the data is turned o in
the output options.
Figure 69 IRIS Single Station Plot
Chapter 5 – Configuring and Scheduling Optional IRIS Products
RESTRICTED 193